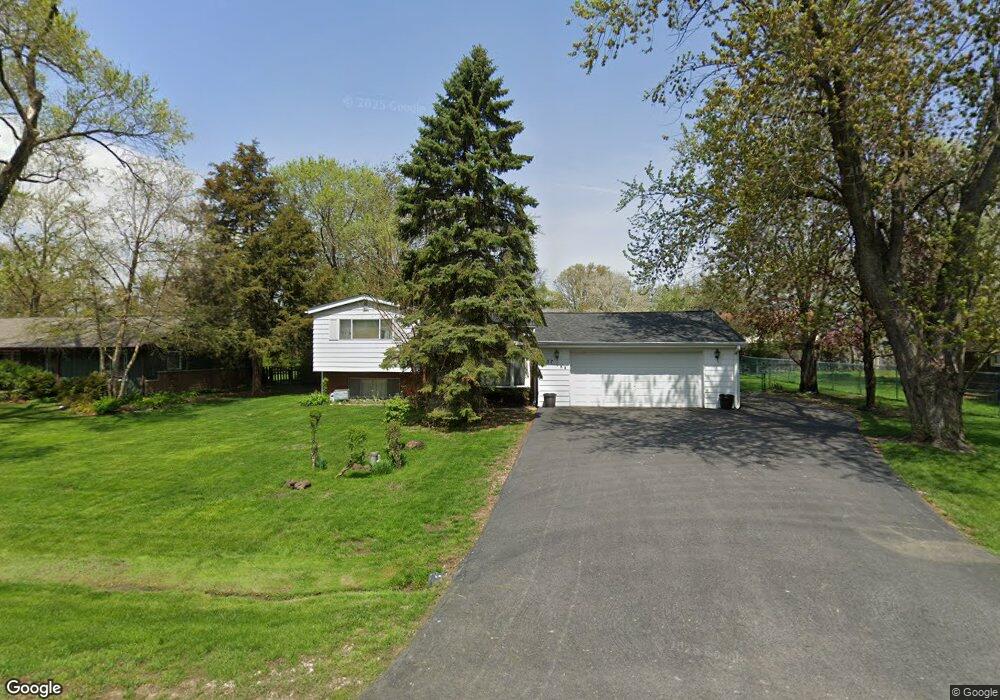
937 Shirley Pkwy Unit 1 New Lenox, IL 60451
Estimated Value: $375,000 - $416,000
--
Bed
--
Bath
--
Sq Ft
0.31
Acres
About This Home
This home is located at 937 Shirley Pkwy Unit 1, New Lenox, IL 60451 and is currently estimated at $402,806. 937 Shirley Pkwy Unit 1 is a home located in Will County with nearby schools including Bentley Elementary School, Arnold J Tyler School, and Alex M Martino Jr High School.
Ownership History
Date
Name
Owned For
Owner Type
Purchase Details
Closed on
Jul 17, 2002
Sold by
Beallis Patrick R and Beallis Kelly A
Bought by
Beallis Patrick R and Beallis Kelly A
Current Estimated Value
Purchase Details
Closed on
Feb 28, 1997
Sold by
Wilson Paul R and Wilson Patricia Ann
Bought by
Beallis Patrick R and Dwyer Kelly A
Home Financials for this Owner
Home Financials are based on the most recent Mortgage that was taken out on this home.
Original Mortgage
$100,000
Outstanding Balance
$12,331
Interest Rate
7.93%
Estimated Equity
$390,475
Purchase Details
Closed on
May 27, 1994
Sold by
Webster Joseph E and Webster Margaret A
Bought by
Wilson Paul R and Wilson Patricia Ann
Home Financials for this Owner
Home Financials are based on the most recent Mortgage that was taken out on this home.
Original Mortgage
$116,500
Interest Rate
8.34%
Mortgage Type
VA
Create a Home Valuation Report for This Property
The Home Valuation Report is an in-depth analysis detailing your home's value as well as a comparison with similar homes in the area
Home Values in the Area
Average Home Value in this Area
Purchase History
| Date | Buyer | Sale Price | Title Company |
|---|---|---|---|
| Beallis Patrick R | -- | -- | |
| Beallis Patrick R | $131,000 | Attorneys Title Guaranty Fun | |
| Wilson Paul R | $119,000 | Chicago Title Insurance Co |
Source: Public Records
Mortgage History
| Date | Status | Borrower | Loan Amount |
|---|---|---|---|
| Open | Beallis Patrick R | $100,000 | |
| Previous Owner | Wilson Paul R | $116,500 |
Source: Public Records
Tax History Compared to Growth
Tax History
| Year | Tax Paid | Tax Assessment Tax Assessment Total Assessment is a certain percentage of the fair market value that is determined by local assessors to be the total taxable value of land and additions on the property. | Land | Improvement |
|---|---|---|---|---|
| 2024 | $6,928 | $96,540 | $24,244 | $72,296 |
| 2023 | $6,928 | $88,003 | $22,100 | $65,903 |
| 2022 | $6,262 | $81,071 | $20,359 | $60,712 |
| 2021 | $5,936 | $76,245 | $19,147 | $57,098 |
| 2020 | $5,760 | $73,525 | $18,464 | $55,061 |
| 2019 | $5,505 | $71,245 | $17,891 | $53,354 |
| 2018 | $5,371 | $68,790 | $17,275 | $51,515 |
| 2017 | $5,093 | $66,812 | $16,778 | $50,034 |
| 2016 | $4,939 | $65,024 | $16,329 | $48,695 |
| 2015 | $4,744 | $62,977 | $15,815 | $47,162 |
| 2014 | $4,744 | $62,200 | $15,620 | $46,580 |
| 2013 | $4,744 | $63,039 | $15,831 | $47,208 |
Source: Public Records
Map
Nearby Homes
- 125 N Anderson Rd
- 1212 Georgias Way
- 1245 Georgias Way
- 214 Somerset Ct
- 1193 Georgias Way
- 1351 E Lincoln Hwy
- 1139 Georgias Way
- 1125 Georgias Way
- 621 Chatfield Rd
- 1017 E Lincoln Hwy
- 513 Somerset Ln
- 449 Somerset Ln Unit 1
- 641 Lisson Grove
- 1535 Glenbrooke Ln
- 1920 Tessington Ct
- 1931 Tessington Ct
- 701 Bishops Gate
- 821 Chatfield Rd
- 12932 Carrington Ct
- 1108 Plaza Dr
- 933 Shirley Pkwy
- 943 Shirley Pkwy
- 940 Herr Dr
- 932 Herr Dr
- 944 Herr Dr Unit 1
- 936 Shirley Pkwy
- 949 Shirley Pkwy
- 110 Lincolnway Dr
- 950 Herr Dr
- 959 Shirley Pkwy
- 117 Lincolnway Dr
- 121 Lincolnway Dr
- 945 Herr Dr
- 956 Herr Dr
- 113 Lincolnway Dr
- 956 Shirley Pkwy
- 924 Herr Dr
- 104 Lincolnway Dr Unit 1
- 949 Herr Dr
- 103 Lincolnway Dr