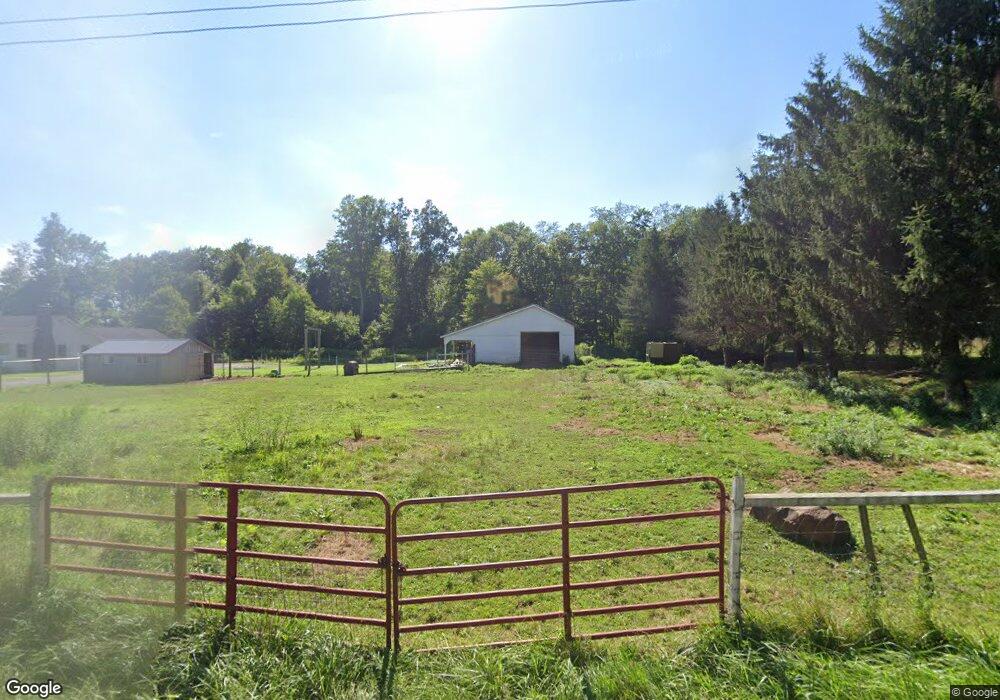
937 Sipe Rd Volant, PA 16156
Estimated Value: $289,000 - $467,000
4
Beds
3
Baths
1,474
Sq Ft
$278/Sq Ft
Est. Value
About This Home
This home is located at 937 Sipe Rd, Volant, PA 16156 and is currently estimated at $409,636, approximately $277 per square foot. 937 Sipe Rd is a home located in Lawrence County with nearby schools including Wilmington Area Elementary School, Wilmington Area Middle School, and Wilmington Area High School.
Ownership History
Date
Name
Owned For
Owner Type
Purchase Details
Closed on
Aug 12, 2020
Sold by
Byler Jonas N and Byler Rachel H
Bought by
Byler Joe A and Byler Iva J
Current Estimated Value
Home Financials for this Owner
Home Financials are based on the most recent Mortgage that was taken out on this home.
Original Mortgage
$234,000
Outstanding Balance
$187,095
Interest Rate
3%
Estimated Equity
$222,541
Purchase Details
Closed on
Aug 9, 2018
Sold by
Sweetland William O and Sweetland Cheryl A
Bought by
Byler Jonas N and Byler Rachel H
Home Financials for this Owner
Home Financials are based on the most recent Mortgage that was taken out on this home.
Original Mortgage
$230,000
Interest Rate
4.5%
Mortgage Type
Purchase Money Mortgage
Purchase Details
Closed on
Nov 3, 2010
Sold by
Short Carol A
Bought by
Sweetland William O and Sweetland Cheryl A
Create a Home Valuation Report for This Property
The Home Valuation Report is an in-depth analysis detailing your home's value as well as a comparison with similar homes in the area
Home Values in the Area
Average Home Value in this Area
Purchase History
| Date | Buyer | Sale Price | Title Company |
|---|---|---|---|
| Byler Joe A | $260,000 | None Available | |
| Byler Jonas N | $305,000 | -- | |
| Sweetland William O | $300,000 | None Available |
Source: Public Records
Mortgage History
| Date | Status | Borrower | Loan Amount |
|---|---|---|---|
| Open | Byler Joe A | $234,000 | |
| Previous Owner | Byler Jonas N | $230,000 |
Source: Public Records
Tax History Compared to Growth
Tax History
| Year | Tax Paid | Tax Assessment Tax Assessment Total Assessment is a certain percentage of the fair market value that is determined by local assessors to be the total taxable value of land and additions on the property. | Land | Improvement |
|---|---|---|---|---|
| 2025 | $6,701 | $243,200 | $66,800 | $176,400 |
| 2024 | $6,143 | $243,200 | $66,800 | $176,400 |
| 2023 | $6,143 | $243,200 | $66,800 | $176,400 |
| 2022 | $6,143 | $243,200 | $66,800 | $176,400 |
| 2021 | $6,045 | $243,200 | $66,800 | $176,400 |
| 2020 | $6,045 | $243,200 | $66,800 | $176,400 |
| 2019 | $5,802 | $243,200 | $66,800 | $176,400 |
| 2018 | $5,676 | $243,200 | $66,800 | $176,400 |
| 2017 | $5,601 | $243,200 | $66,800 | $176,400 |
| 2016 | $1,706 | $243,200 | $66,800 | $176,400 |
| 2015 | $1,706 | $243,200 | $66,800 | $176,400 |
| 2014 | $1,706 | $243,200 | $66,800 | $176,400 |
Source: Public Records
Map
Nearby Homes
- Lot #14 Hunt Saddle Ln
- 315 Maidenblush Dr
- Lot 504-505 Southbrook Dr
- 4536 State Route 158
- 1218 McGary Rd
- 168 Cunningham Ln
- 402 Woodland Dr
- 127 W Vine St
- 335 Algoma Ln
- 169 Horseshoe Ln
- 167 Horseshoe Ln
- 4166 Pennsylvania 158
- 419 W Neshannock Ave
- 145 High St
- 3660 State Route 208
- 3674 Pennsylvania 208
- 258 Justice Ln
- 3205 Eastbrook Volant Rd
- 47 Wynfield Ln
- 1975 Mercer New Wilmington Rd
- 916 Sipe Rd
- 970 Sipe Rd
- 1107 Sipe Rd
- 0 Sipe Rd Unit 1004595
- 0 Sipe Rd Unit 1053581
- 711 Sipe Rd
- 711 Sipe Rd
- 1161 Sipe Rd
- 381 Fayette Neshannock Falls Rd
- 1197 Sipe Rd
- 3213 Pennsylvania 956 Unit Twp
- 616 Bent Oak Ln
- 346 Fayette Neshannock Falls Rd
- 378 Fayette-Neshannock Falls Rd
- 378 Fayette Neshannock Falls Rd
- 119 Purple Martin Ln
- 310 Fayette Neshannock Falls Rd
- 529 Fayette Nesh Falls Rd
- 582 Mast Ln
- 510 Sipe Rd