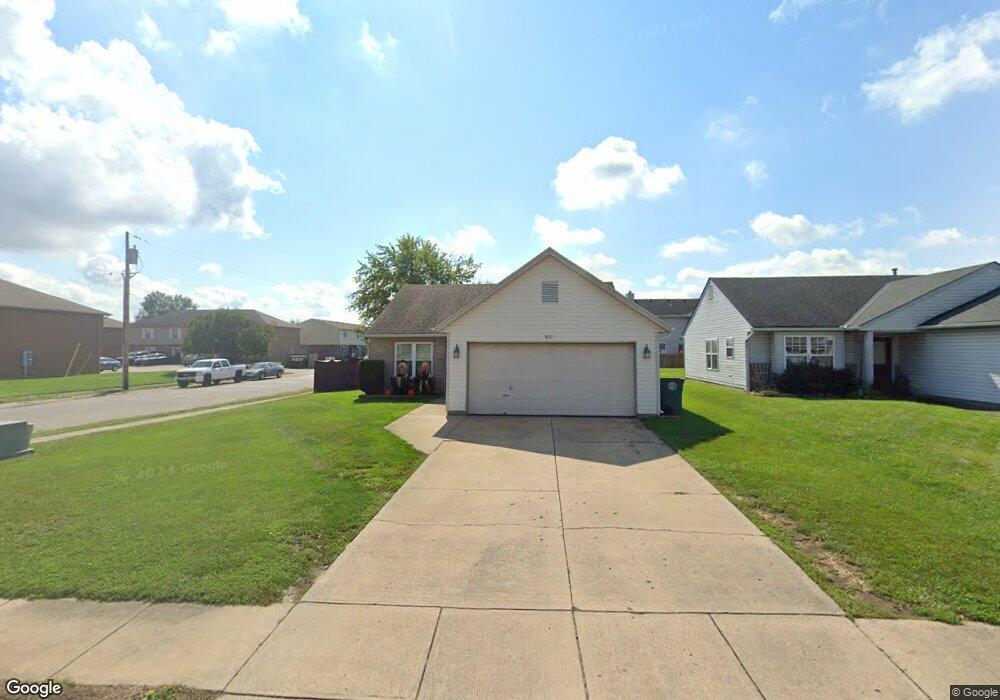
937 W Branch St Trenton, OH 45067
Estimated Value: $199,000 - $213,121
2
Beds
2
Baths
1,050
Sq Ft
$196/Sq Ft
Est. Value
About This Home
This home is located at 937 W Branch St, Trenton, OH 45067 and is currently estimated at $206,030, approximately $196 per square foot. 937 W Branch St is a home located in Butler County with nearby schools including Edgewood Intermediate School and Edgewood High School.
Ownership History
Date
Name
Owned For
Owner Type
Purchase Details
Closed on
Aug 23, 2013
Sold by
Lakins Glen F and Lakins Brenda L
Bought by
Lakins Glen F and Lakins Brenda L
Current Estimated Value
Home Financials for this Owner
Home Financials are based on the most recent Mortgage that was taken out on this home.
Original Mortgage
$102,510
Outstanding Balance
$76,203
Interest Rate
4.38%
Mortgage Type
FHA
Estimated Equity
$129,827
Purchase Details
Closed on
Feb 20, 2001
Sold by
Beiser Patrick J and Beiser Julie A
Bought by
Lakins Glen F
Home Financials for this Owner
Home Financials are based on the most recent Mortgage that was taken out on this home.
Original Mortgage
$94,024
Interest Rate
6.91%
Mortgage Type
FHA
Purchase Details
Closed on
Nov 20, 1996
Sold by
Crossman Communities Of
Bought by
Beiser Patrick J and Beiser Julie
Home Financials for this Owner
Home Financials are based on the most recent Mortgage that was taken out on this home.
Original Mortgage
$83,793
Interest Rate
7.94%
Mortgage Type
FHA
Create a Home Valuation Report for This Property
The Home Valuation Report is an in-depth analysis detailing your home's value as well as a comparison with similar homes in the area
Home Values in the Area
Average Home Value in this Area
Purchase History
| Date | Buyer | Sale Price | Title Company |
|---|---|---|---|
| Lakins Glen F | -- | None Available | |
| Lakins Glen F | $95,500 | Midland Title Security Inc | |
| Beiser Patrick J | $82,900 | -- |
Source: Public Records
Mortgage History
| Date | Status | Borrower | Loan Amount |
|---|---|---|---|
| Open | Lakins Glen F | $102,510 | |
| Closed | Lakins Glen F | $94,024 | |
| Previous Owner | Beiser Patrick J | $83,793 |
Source: Public Records
Tax History Compared to Growth
Tax History
| Year | Tax Paid | Tax Assessment Tax Assessment Total Assessment is a certain percentage of the fair market value that is determined by local assessors to be the total taxable value of land and additions on the property. | Land | Improvement |
|---|---|---|---|---|
| 2024 | $2,366 | $56,230 | $8,960 | $47,270 |
| 2023 | $2,355 | $55,590 | $8,960 | $46,630 |
| 2022 | $2,030 | $42,540 | $8,960 | $33,580 |
| 2021 | $1,951 | $42,540 | $8,960 | $33,580 |
| 2020 | $2,079 | $42,540 | $8,960 | $33,580 |
| 2019 | $2,065 | $35,990 | $9,780 | $26,210 |
| 2018 | $1,867 | $35,990 | $9,780 | $26,210 |
| 2017 | $1,868 | $35,990 | $9,780 | $26,210 |
| 2016 | $1,713 | $31,490 | $9,780 | $21,710 |
| 2015 | $1,457 | $31,490 | $9,780 | $21,710 |
| 2014 | $1,643 | $31,490 | $9,780 | $21,710 |
| 2013 | $1,643 | $32,210 | $9,780 | $22,430 |
Source: Public Records
Map
Nearby Homes
- 931 E Branch Ct
- 984 Pom Ct
- 984 Pom Ct Unit A
- 983 Pom Ct
- 5373 Gabbard Dr
- 917 Hathaway Dr
- 806 Somerset Ct
- 807 Somerset Ct
- 700 Villa Ct
- 801 Carriage Ln
- 717 Villa Ct
- 807 Countryside Ave
- 220 Governors Ave
- 914 Providence Ct
- 821 Prescot Cir
- 109 Cranewood Dr
- 801 Prescot Cir
- 408 Pierson Rd
- 202 W State St
- 425 Heritage Place