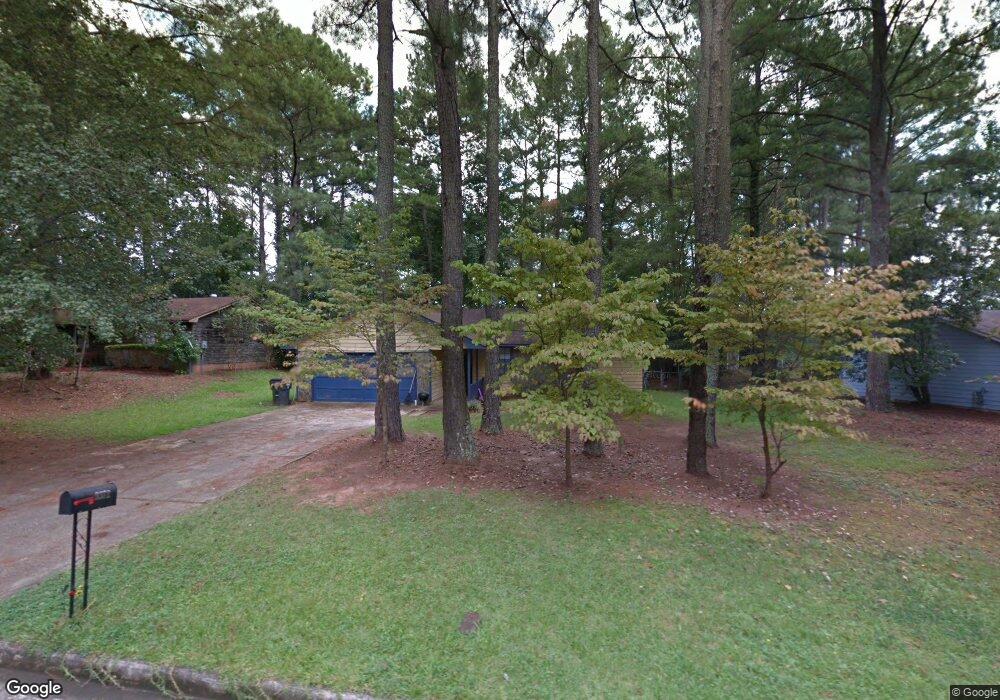
9372 Woodknoll Way Unit 4 Jonesboro, GA 30238
Estimated Value: $206,000 - $229,692
3
Beds
2
Baths
1,189
Sq Ft
$182/Sq Ft
Est. Value
About This Home
This home is located at 9372 Woodknoll Way Unit 4, Jonesboro, GA 30238 and is currently estimated at $216,423, approximately $182 per square foot. 9372 Woodknoll Way Unit 4 is a home located in Clayton County with nearby schools including Kemp Primary School, Kemp Elementary School, and Pointe South Middle School.
Ownership History
Date
Name
Owned For
Owner Type
Purchase Details
Closed on
Nov 23, 2010
Sold by
Copeland Anthony and Copeland Deandria
Bought by
Copeland Anthony and Copeland Deandria
Current Estimated Value
Home Financials for this Owner
Home Financials are based on the most recent Mortgage that was taken out on this home.
Original Mortgage
$88,009
Outstanding Balance
$59,370
Interest Rate
4.87%
Mortgage Type
FHA
Estimated Equity
$157,053
Purchase Details
Closed on
May 25, 2000
Sold by
Meninger Harold L
Bought by
Copeland Anthony
Home Financials for this Owner
Home Financials are based on the most recent Mortgage that was taken out on this home.
Original Mortgage
$93,283
Interest Rate
8.23%
Mortgage Type
FHA
Purchase Details
Closed on
Feb 24, 1995
Sold by
Alley Greg M
Bought by
Meninger Harold L
Home Financials for this Owner
Home Financials are based on the most recent Mortgage that was taken out on this home.
Original Mortgage
$65,593
Interest Rate
9.05%
Mortgage Type
FHA
Create a Home Valuation Report for This Property
The Home Valuation Report is an in-depth analysis detailing your home's value as well as a comparison with similar homes in the area
Home Values in the Area
Average Home Value in this Area
Purchase History
| Date | Buyer | Sale Price | Title Company |
|---|---|---|---|
| Copeland Anthony | -- | -- | |
| Copeland Anthony | $93,500 | -- | |
| Meninger Harold L | $66,000 | -- |
Source: Public Records
Mortgage History
| Date | Status | Borrower | Loan Amount |
|---|---|---|---|
| Open | Copeland Anthony | $88,009 | |
| Previous Owner | Copeland Anthony | $93,283 | |
| Previous Owner | Meninger Harold L | $65,593 |
Source: Public Records
Tax History Compared to Growth
Tax History
| Year | Tax Paid | Tax Assessment Tax Assessment Total Assessment is a certain percentage of the fair market value that is determined by local assessors to be the total taxable value of land and additions on the property. | Land | Improvement |
|---|---|---|---|---|
| 2025 | $2,958 | $77,240 | $7,200 | $70,040 |
| 2024 | $3,052 | $78,240 | $7,200 | $71,040 |
| 2023 | $2,488 | $68,920 | $7,200 | $61,720 |
| 2022 | $2,193 | $55,880 | $7,200 | $48,680 |
| 2021 | $1,810 | $45,840 | $7,200 | $38,640 |
| 2020 | $1,462 | $36,545 | $7,200 | $29,345 |
| 2019 | $1,255 | $30,902 | $5,600 | $25,302 |
| 2018 | $1,005 | $24,754 | $5,600 | $19,154 |
| 2017 | $849 | $20,854 | $5,600 | $15,254 |
| 2016 | $767 | $18,847 | $5,600 | $13,247 |
| 2015 | $697 | $0 | $0 | $0 |
| 2014 | $832 | $20,909 | $5,600 | $15,309 |
Source: Public Records
Map
Nearby Homes
- 9383 Woodknoll Way Unit 4
- 9409 Forest Knoll Dr
- 9342 Thomas Rd
- 9404 Bogey Ct
- 9404 Cypress Ln
- 9181 Welch Ct
- 725 River Mist Dr
- 316 River Chase Dr
- 9556 Thomas Downs Ln Unit 1
- 9138 Sunset Dr Unit 3
- 301 Deerfield Dr
- 22 Fairview Dr
- 296 Country Club Dr
- 556 Country Greens Dr
- 299 Country Club Dr
- 237 Country Club Dr
- 288 Country Club Dr
- 281 Willow Springs Dr
- 254 Country Club Dr
- 273 Martin Dr
- 9366 Woodknoll Way
- 9378 Woodknoll Way
- 9389 Woodloop Ct
- 9388 Woodknoll Way Unit 4
- 9388 Woodknoll Way
- 9362 Woodknoll Way
- 9383 Woodloop Ct
- 9395 Woodloop Ct Unit 5
- 9371 Woodknoll Way Unit 4
- 9396 Woodknoll Way
- 9365 Woodknoll Way
- 9365 Woodknoll Way Unit 39
- 9358 Woodknoll Way Unit 4
- 9375 Woodknoll Way
- 9361 Woodknoll Way
- 9371 Woodloop Ct Unit 5
- 9404 Woodknoll Way
- 9379 Woodknoll Way
- 9387 Woodknoll Way Unit 4
- 9357 Woodknoll Way Unit 4