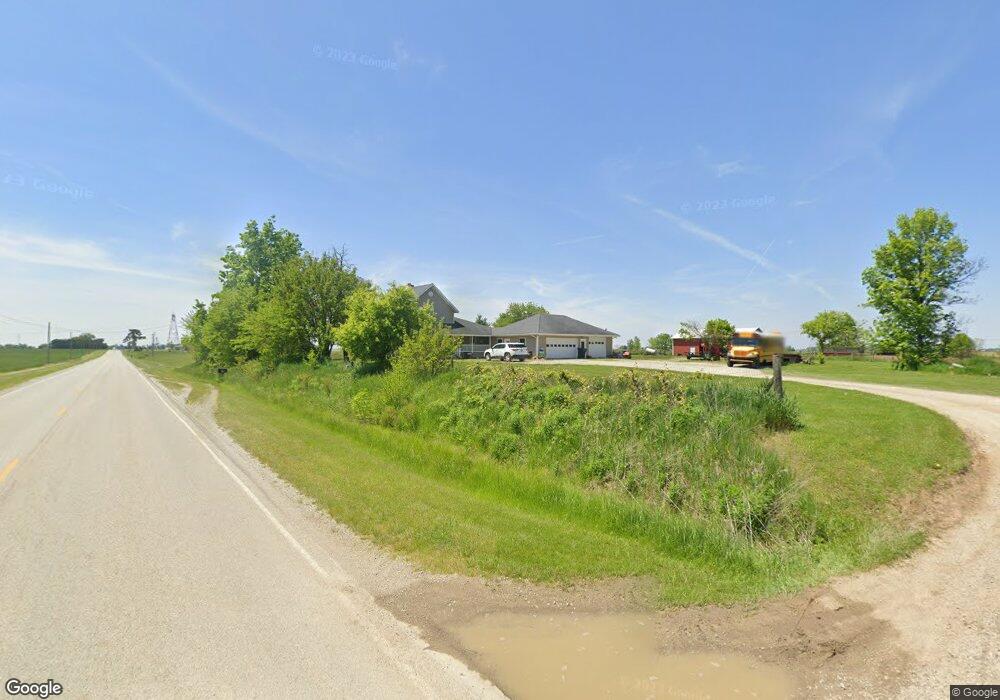
9374 N Marzane Rd-90 Unit 90 Markle, IN 46770
Estimated Value: $312,000 - $484,000
4
Beds
2
Baths
1,830
Sq Ft
$198/Sq Ft
Est. Value
About This Home
This home is located at 9374 N Marzane Rd-90 Unit 90, Markle, IN 46770 and is currently estimated at $362,444, approximately $198 per square foot. 9374 N Marzane Rd-90 Unit 90 is a home located in Wells County with nearby schools including Norwell High School.
Ownership History
Date
Name
Owned For
Owner Type
Purchase Details
Closed on
Jun 30, 2023
Sold by
Bolinger Dale A and Bolinger Anita G
Bought by
Bushee Travis J and Bolinger-Bushee Melissa L
Current Estimated Value
Home Financials for this Owner
Home Financials are based on the most recent Mortgage that was taken out on this home.
Original Mortgage
$234,025
Outstanding Balance
$228,902
Interest Rate
7.25%
Mortgage Type
FHA
Estimated Equity
$133,542
Purchase Details
Closed on
Apr 12, 2018
Sold by
Bolinger Dale A
Bought by
Bushee Travis
Purchase Details
Closed on
Sep 28, 2007
Sold by
Hettinger Cynthia Mustaine and Hettinger Anthony P
Bought by
Bolinger Dale A and Bolinger Anita G
Purchase Details
Closed on
Sep 19, 2007
Sold by
Sheriff Of Wells Co
Bought by
Bolinger Dale A and Bolinger Anita G
Purchase Details
Closed on
Jul 18, 2000
Sold by
Kyle Bailey and Kyle Wendy S
Bought by
Hettinger Anthony and Hettinger Cynthia M
Purchase Details
Closed on
Jan 31, 2000
Sold by
Adjusted Acreage and Clear To Clear
Bought by
Up Overlap
Create a Home Valuation Report for This Property
The Home Valuation Report is an in-depth analysis detailing your home's value as well as a comparison with similar homes in the area
Home Values in the Area
Average Home Value in this Area
Purchase History
| Date | Buyer | Sale Price | Title Company |
|---|---|---|---|
| Bushee Travis J | -- | None Listed On Document | |
| Bushee Travis | $150,000 | -- | |
| Bolinger Dale A | $78,000 | None Available | |
| Bolinger Dale A | $78,000 | -- | |
| Hettinger Anthony | $145,000 | -- | |
| Up Overlap | -- | -- |
Source: Public Records
Mortgage History
| Date | Status | Borrower | Loan Amount |
|---|---|---|---|
| Open | Bushee Travis J | $234,025 |
Source: Public Records
Tax History Compared to Growth
Tax History
| Year | Tax Paid | Tax Assessment Tax Assessment Total Assessment is a certain percentage of the fair market value that is determined by local assessors to be the total taxable value of land and additions on the property. | Land | Improvement |
|---|---|---|---|---|
| 2024 | $1,616 | $267,400 | $62,900 | $204,500 |
| 2023 | $1,653 | $266,200 | $46,900 | $219,300 |
| 2022 | $1,399 | $223,700 | $38,600 | $185,100 |
| 2021 | $1,195 | $201,800 | $36,900 | $164,900 |
| 2020 | $964 | $185,400 | $36,900 | $148,500 |
| 2019 | $939 | $174,800 | $39,100 | $135,700 |
| 2018 | $885 | $166,800 | $31,100 | $135,700 |
| 2017 | $1,130 | $110,200 | $32,900 | $77,300 |
| 2016 | $1,109 | $106,400 | $32,900 | $73,500 |
| 2014 | $1,195 | $106,600 | $36,100 | $70,500 |
| 2013 | -- | $139,000 | $32,800 | $106,200 |
Source: Public Records
Map
Nearby Homes
- 500 W 800 N-90
- TBD W 900 N
- 2405 W 900 N
- 11130 N 300 W
- 2501 W 1100 N
- 17820 N Wayne St
- 11136 N 200 W
- TBD W Yoder Rd
- TBD N 200 W
- 451 Cottonwood Ct
- 10930 Yoder Rd
- 310 Cottonwood Ct
- 16902 Prine Rd
- 3680 W 550 N
- 4255 NW State Road 116-90
- TBD N 200 W
- * Ginger Rd
- 13011 Hamilton Rd
- 5798 N 200 W
- 9002 W Yoder Rd
- 9280 N Marzane Rd-90
- 9280 N Marzane Rd
- 9210 N Marzane Rd-90
- 9156 N Marzane Rd-90
- 9660 N Marzane Rd-90 Unit 90
- 9124 N Marzane Rd-90
- 9124 N Marzane Rd
- TBD N Marzane Rd
- 4759 W 900 N-90
- 9726 N Marzane Rd-90 Unit 90
- 9726 N Marzane Rd
- 4477 W 900 N-90
- 4477 W 900 N-90 Unit 90
- 4477 W 900 N-90 Unit 90
- 4477 W 900 North-90
- 8901 N Marzane Rd-90 Unit 90
- 4298 W 900 N-90 Unit 90
- 5017 W 900 N-90 Unit 90
- 9718 N 500 W-90 Unit 90
- 9821 N 500 W-90 Unit 90