


9378 Fox Run Cir Unit 21B Frankfort, IL 60423
North Frankfort NeighborhoodEstimated payment $3,623/month
Highlights
- Landscaped Professionally
- Mature Trees
- Recreation Room
- Chelsea Intermediate School Rated A
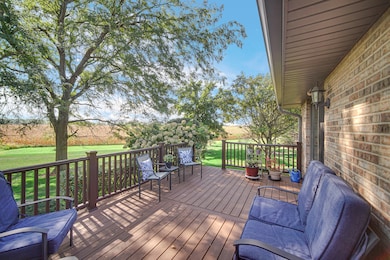
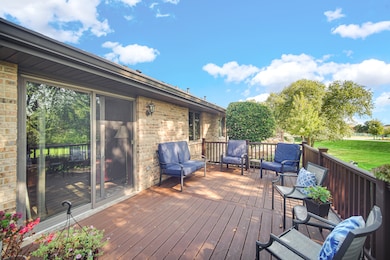
- Deck
- Wood Flooring
About This Home
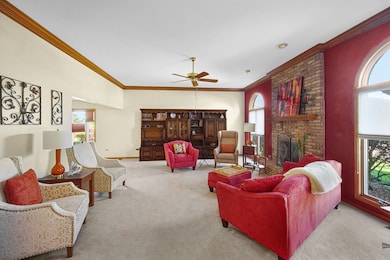
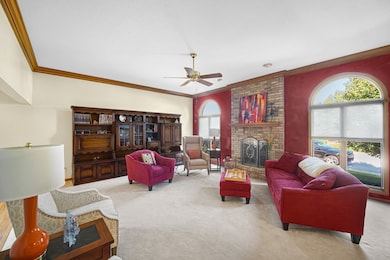
Welcome to Hunt Club Estates! This stunning 2-bedroom, 3 full bath home features an open, inviting layout with hardwood floors in the foyer, kitchen, and dining areas. The bright living room offers amazing lighting and a cozy gas fireplace, with an additional family room for extra space. The kitchen is a chef's delight with custom cabinetry, granite countertops, and direct access to the dining area-perfect for entertaining. The primary suite includes a spa-like bath with double sinks, jetted tub, and separate shower. A newly finished basement adds versatility with a recreation room, sitting area, full bath, and two bonus rooms ideal for offices, hobbies, or guests. The additional crawl storage as well. Outdoors, enjoy a low-maintenance newly done Trex deck and an attached 2-car garage. Residents enjoy resort-style amenities such as a clubhouse and sparkling pool-perfect for connecting with neighbors in this vibrant all-ages community. HOA fees include lawn care, common area insurance, and snow removal. Don't miss your chance to own in one of Frankfort's most desirable areas-where location, lifestyle, and long-term value come together.
Listing Agent
Keller Williams Preferred Rlty License #475162394 Listed on: 10/01/2025

Townhouse Details
Home Type
- Townhome
Est. Annual Taxes
- $9,388
Year Built
- Built in 1994 | Remodeled in 2022
Lot Details
- End Unit
- Landscaped Professionally
- Mature Trees
HOA Fees
- $333 Monthly HOA Fees
Parking
- 2 Car Garage
- Driveway
- Parking Included in Price
Home Design
- Entry on the 1st floor
- Brick Exterior Construction
- Asphalt Roof
- Concrete Perimeter Foundation
Interior Spaces
- 2,168 Sq Ft Home
- 1-Story Property
- Ceiling Fan
- Skylights
- Wood Burning Fireplace
- Fireplace With Gas Starter
- Window Screens
- Entrance Foyer
- Family Room
- Living Room with Fireplace
- Sitting Room
- Combination Kitchen and Dining Room
- Home Office
- Recreation Room
- Bonus Room
- Lower Floor Utility Room
Kitchen
- Range
- Microwave
- Dishwasher
- Disposal
Flooring
- Wood
- Carpet
Bedrooms and Bathrooms
- 2 Bedrooms
- 2 Potential Bedrooms
- Walk-In Closet
- Bathroom on Main Level
- 3 Full Bathrooms
- Dual Sinks
- Whirlpool Bathtub
- Separate Shower
Laundry
- Laundry Room
- Dryer
- Washer
- Sink Near Laundry
Basement
- Basement Fills Entire Space Under The House
- Sump Pump
- Finished Basement Bathroom
Home Security
Accessible Home Design
- Grab Bar In Bathroom
- Accessibility Features
- No Interior Steps
- More Than Two Accessible Exits
- Level Entry For Accessibility
Outdoor Features
- Deck
Utilities
- Forced Air Heating and Cooling System
- Heating System Uses Natural Gas
- 200+ Amp Service
- Shared Well
- Gas Water Heater
- Water Softener is Owned
Listing and Financial Details
- Senior Tax Exemptions
- Homeowner Tax Exemptions
Community Details
Overview
- Association fees include clubhouse, pool, lawn care, snow removal
- 2 Units
- Management Association, Phone Number (708) 922-9144
- Hunt Club Estates Subdivision
- Property managed by Hunt Club Condo
Pet Policy
- Dogs and Cats Allowed
Security
- Resident Manager or Management On Site
- Storm Doors
- Carbon Monoxide Detectors
Map
Home Values in the Area
Average Home Value in this Area
Tax History
| Year | Tax Paid | Tax Assessment Tax Assessment Total Assessment is a certain percentage of the fair market value that is determined by local assessors to be the total taxable value of land and additions on the property. | Land | Improvement |
|---|---|---|---|---|
| 2024 | $9,388 | $134,489 | $780 | $133,709 |
| 2023 | $9,388 | $120,112 | $697 | $119,415 |
| 2022 | $8,351 | $109,402 | $635 | $108,767 |
| 2021 | $7,840 | $102,350 | $594 | $101,756 |
| 2020 | $7,687 | $99,465 | $577 | $98,888 |
| 2019 | $7,370 | $96,803 | $562 | $96,241 |
| 2018 | $7,223 | $94,020 | $546 | $93,474 |
| 2017 | $7,205 | $91,825 | $533 | $91,292 |
| 2016 | $7,016 | $88,677 | $515 | $88,162 |
| 2015 | $6,787 | $85,554 | $497 | $85,057 |
| 2014 | $6,787 | $84,960 | $494 | $84,466 |
| 2013 | $6,787 | $86,699 | $1,986 | $84,713 |
Property History
| Date | Event | Price | List to Sale | Price per Sq Ft |
|---|---|---|---|---|
| 10/11/2025 10/11/25 | Pending | -- | -- | -- |
| 10/01/2025 10/01/25 | For Sale | $479,000 | -- | $221 / Sq Ft |
Purchase History
| Date | Type | Sale Price | Title Company |
|---|---|---|---|
| Interfamily Deed Transfer | -- | None Available | |
| Deed | $296,000 | Fatic | |
| Warranty Deed | $265,000 | Greater Illinois Title Compa |
Mortgage History
| Date | Status | Loan Amount | Loan Type |
|---|---|---|---|
| Previous Owner | $75,000 | No Value Available |
Source: Midwest Real Estate Data (MRED)
MLS Number: 12481028
APN: 19-09-22-128-005-1002
Disclaimer: Certain information contained herein is derived from information provided by parties other than Homes.com. All information provided is deemed reliable, but is not guaranteed to be accurate and should be independently verified.
![]() Based on information submitted to the MLS GRID. All data is obtained from various sources and may not have been verified by broker or MLS GRID. Supplied Open House Information is subject to change without notice. All information should be independently reviewed and verified for accuracy. Properties may or may not be listed by the office/agent presenting the information. Some IDX listings have been excluded from this website.
Based on information submitted to the MLS GRID. All data is obtained from various sources and may not have been verified by broker or MLS GRID. Supplied Open House Information is subject to change without notice. All information should be independently reviewed and verified for accuracy. Properties may or may not be listed by the office/agent presenting the information. Some IDX listings have been excluded from this website.
The Digital Millennium Copyright Act of 1998, 17 U.S.C. § 512 (the “DMCA”) provides recourse for copyright owners who believe that material appearing on the Internet infringes their rights under U.S. copyright law. If you believe in good faith that any content or material made available in connection with our website or services infringes your copyright, you (or your agent) may send us a notice requesting that the content or material be removed, or access to it blocked.
Notices must be sent in writing by email to DMCAnotice@MLSGrid.com.
The DMCA requires that your notice of alleged copyright infringement include the following information:
(1) description of the copyrighted work that is the subject of claimed infringement;
(2) description of the alleged infringing content and information sufficient to permit us to locate the content;
(3) contact information for you, including your address, telephone number and email address;
(4) a statement by you that you have a good faith belief that the content in the manner complained of is not authorized by the copyright owner, or its agent, or by the operation of any law;
(5) a statement by you, signed under penalty of perjury, that the information in the notification is accurate and that you have the authority to enforce the copyrights that are claimed to be infringed; and
(6) a physical or electronic signature of the copyright owner or a person authorized to act on the copyright owner’s behalf. Failure to include all of the above information may result in the delay of the processing of your complaint.
- 9335 Fox Run Cir
- 9293 Vesper Ln
- 20659 Abbey Dr
- 20602 Abbey Dr
- 20644 Grand Haven Dr
- 21203 S 93rd Ave
- 21160 S 93rd Ave
- 21213 S 93rd Ave
- 20665 Grand Haven Dr
- 9004 Port Washington Dr
- 8964 Port Washington Dr
- 8855 Milwaukee Breakwater Dr
- 8884 Port Washington Dr
- 8839 Indiana Harbor Dr
- 9724 Folkers Dr
- 9736 Folkers Dr
- 9772 Folkers Dr
- 20277 Brendan St
- 20399 Grosse Point Dr Unit 123
- 9748 Folkers Dr