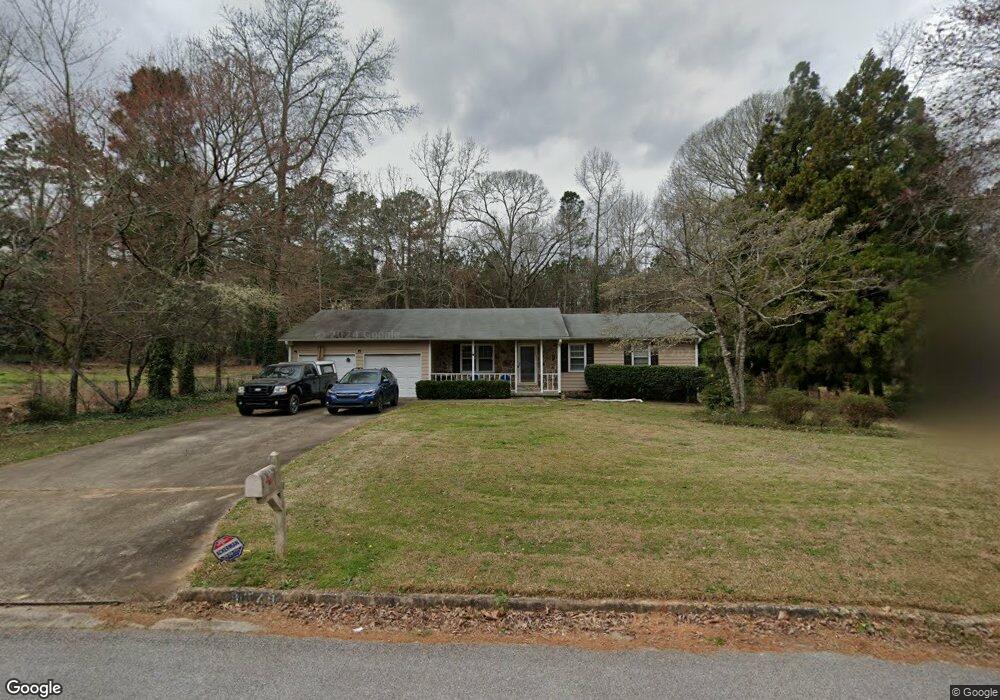
9379 Corbin Rd Jonesboro, GA 30236
Estimated Value: $220,000 - $284,000
3
Beds
2
Baths
1,872
Sq Ft
$133/Sq Ft
Est. Value
About This Home
This home is located at 9379 Corbin Rd, Jonesboro, GA 30236 and is currently estimated at $248,772, approximately $132 per square foot. 9379 Corbin Rd is a home located in Clayton County with nearby schools including Suder Elementary School, M. D. Roberts Middle School, and Jonesboro High School.
Ownership History
Date
Name
Owned For
Owner Type
Purchase Details
Closed on
Jul 22, 2025
Sold by
Hibbs Lacy
Bought by
Cavins Nathen W
Current Estimated Value
Purchase Details
Closed on
Jul 8, 2025
Sold by
Hibbs Janet Tyler
Bought by
Cavins Lacy Hibbs and Parker Dax Tyler
Purchase Details
Closed on
Apr 2, 2003
Sold by
Collins Thomas R and Collins Norma J
Bought by
Hibbs Lacy
Home Financials for this Owner
Home Financials are based on the most recent Mortgage that was taken out on this home.
Original Mortgage
$115,411
Interest Rate
5.62%
Mortgage Type
FHA
Purchase Details
Closed on
Nov 30, 2001
Sold by
Barron Debra R
Bought by
Collins Thomas R and Collins Norma J
Home Financials for this Owner
Home Financials are based on the most recent Mortgage that was taken out on this home.
Original Mortgage
$121,150
Interest Rate
6.72%
Mortgage Type
VA
Create a Home Valuation Report for This Property
The Home Valuation Report is an in-depth analysis detailing your home's value as well as a comparison with similar homes in the area
Home Values in the Area
Average Home Value in this Area
Purchase History
| Date | Buyer | Sale Price | Title Company |
|---|---|---|---|
| Cavins Nathen W | -- | -- | |
| Cavins Lacy Hibbs | -- | -- | |
| Hibbs Lacy | $123,500 | -- | |
| Collins Thomas R | $117,700 | -- |
Source: Public Records
Mortgage History
| Date | Status | Borrower | Loan Amount |
|---|---|---|---|
| Previous Owner | Hibbs Lacy | $115,411 | |
| Previous Owner | Collins Thomas R | $121,150 |
Source: Public Records
Tax History Compared to Growth
Tax History
| Year | Tax Paid | Tax Assessment Tax Assessment Total Assessment is a certain percentage of the fair market value that is determined by local assessors to be the total taxable value of land and additions on the property. | Land | Improvement |
|---|---|---|---|---|
| 2024 | $1,133 | $66,520 | $7,200 | $59,320 |
| 2023 | $2,265 | $62,720 | $7,200 | $55,520 |
| 2022 | $1,003 | $60,240 | $7,200 | $53,040 |
| 2021 | $839 | $51,200 | $7,200 | $44,000 |
| 2020 | $643 | $40,369 | $7,200 | $33,169 |
| 2019 | $745 | $44,461 | $6,400 | $38,061 |
| 2018 | $682 | $41,357 | $6,400 | $34,957 |
| 2017 | $628 | $37,433 | $6,400 | $31,033 |
| 2016 | $637 | $37,853 | $6,400 | $31,453 |
| 2015 | $626 | $0 | $0 | $0 |
| 2014 | $473 | $32,018 | $6,400 | $25,618 |
Source: Public Records
Map
Nearby Homes
- 2744 Lisa Dr
- 2769 Stancil Blvd
- 2811 Carnes Rd
- 2461 Creekside Trace
- 9361 Sweetbriar Cir
- 9344 Hidden Hollow Trail
- 2544 Carnes Rd
- 3027 Jodeco Dr
- 2519 Quentin Dr
- 2508 Quentin Dr
- 3194 Liverpool St
- 2283 Noahs Ark Rd
- 2444 Quentin Dr
- 0 Carnes Rd Unit 7665396
- 3080 Jodeco Dr
- 3117 Jodeco Dr
- 2328 Carnes Rd
- 3223 Rhonda Dr
- 2330 Lago Dr
- 2345 Lake Jodeco Rd
- 9367 Corbin Rd
- 2730 Stancil Blvd Unit 3
- 9380 Corbin Rd Unit 3
- 2726 Stancil Blvd
- 9355 Corbin Rd
- 9368 Corbin Rd
- 0 Corbin Rd Unit 7307036
- 0 Corbin Rd Unit 3235217
- 2729 Stancil Blvd
- 9356 Corbin Rd Unit 3
- 9343 Corbin Rd Unit 4
- 9343 Corbin Rd Unit 3
- 9343 Corbin Rd
- 9343 Corbin Rd
- 2720 Stancil Blvd Unit 2
- 2743 Stancil Blvd
- 2752 Stancil Blvd
- 9344 Corbin Rd Unit 3
- 9331 Corbin Rd
- 2716 Stancil Blvd