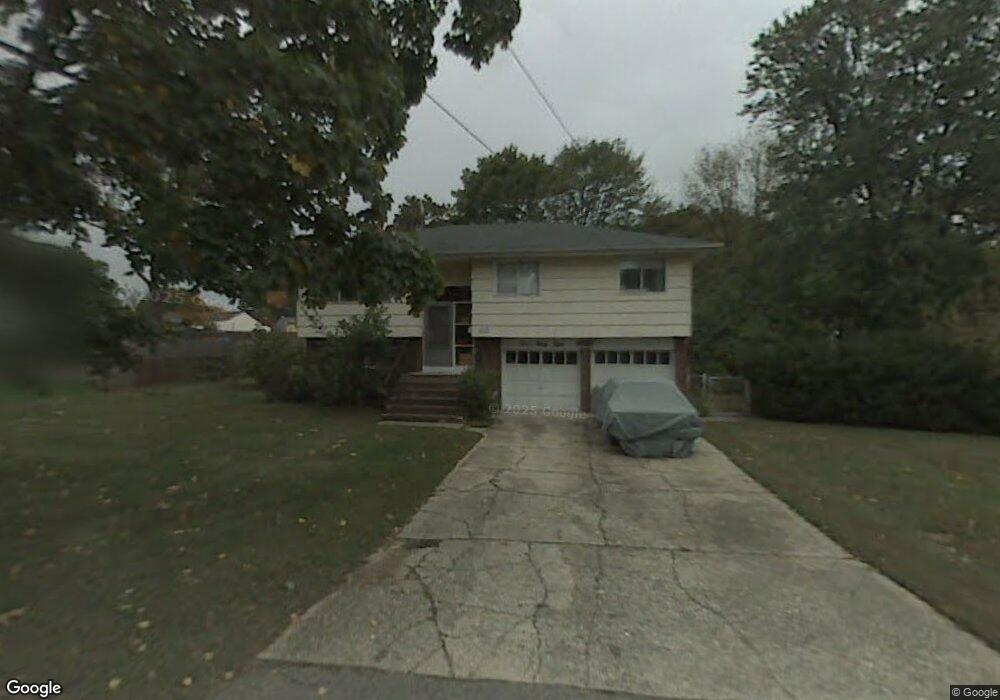
938 7th St West Babylon, NY 11704
Estimated Value: $656,835 - $781,000
4
Beds
2
Baths
1,609
Sq Ft
$445/Sq Ft
Est. Value
About This Home
This home is located at 938 7th St, West Babylon, NY 11704 and is currently estimated at $715,209, approximately $444 per square foot. 938 7th St is a home located in Suffolk County.
Ownership History
Date
Name
Owned For
Owner Type
Purchase Details
Closed on
Nov 3, 2016
Sold by
Ervolino Donald
Bought by
Carpio Bryant E
Current Estimated Value
Home Financials for this Owner
Home Financials are based on the most recent Mortgage that was taken out on this home.
Original Mortgage
$372,135
Outstanding Balance
$301,829
Interest Rate
3.75%
Mortgage Type
FHA
Estimated Equity
$413,380
Purchase Details
Closed on
Jan 13, 2016
Sold by
Caccamo Aldo
Bought by
Ervolino Donald
Purchase Details
Closed on
Jul 27, 1995
Sold by
Caccamo Aldo and Albertini Margaret
Bought by
Caccamo Aldo
Create a Home Valuation Report for This Property
The Home Valuation Report is an in-depth analysis detailing your home's value as well as a comparison with similar homes in the area
Home Values in the Area
Average Home Value in this Area
Purchase History
| Date | Buyer | Sale Price | Title Company |
|---|---|---|---|
| Carpio Bryant E | $379,000 | None Available | |
| Ervolino Donald | $212,500 | None Available | |
| Caccamo Aldo | $46,000 | First American Title Ins Co |
Source: Public Records
Mortgage History
| Date | Status | Borrower | Loan Amount |
|---|---|---|---|
| Open | Carpio Bryant E | $372,135 |
Source: Public Records
Tax History Compared to Growth
Tax History
| Year | Tax Paid | Tax Assessment Tax Assessment Total Assessment is a certain percentage of the fair market value that is determined by local assessors to be the total taxable value of land and additions on the property. | Land | Improvement |
|---|---|---|---|---|
| 2024 | $13,046 | $3,530 | $340 | $3,190 |
| 2023 | $13,046 | $3,530 | $340 | $3,190 |
| 2022 | $9,398 | $3,530 | $340 | $3,190 |
| 2021 | $9,398 | $3,530 | $340 | $3,190 |
| 2020 | $11,667 | $3,530 | $340 | $3,190 |
| 2019 | $11,667 | $0 | $0 | $0 |
| 2018 | $11,296 | $3,530 | $340 | $3,190 |
| 2017 | $11,296 | $3,530 | $340 | $3,190 |
| 2016 | $12,034 | $3,530 | $340 | $3,190 |
| 2015 | -- | $3,530 | $340 | $3,190 |
| 2014 | -- | $3,530 | $340 | $3,190 |
Source: Public Records
Map
Nearby Homes