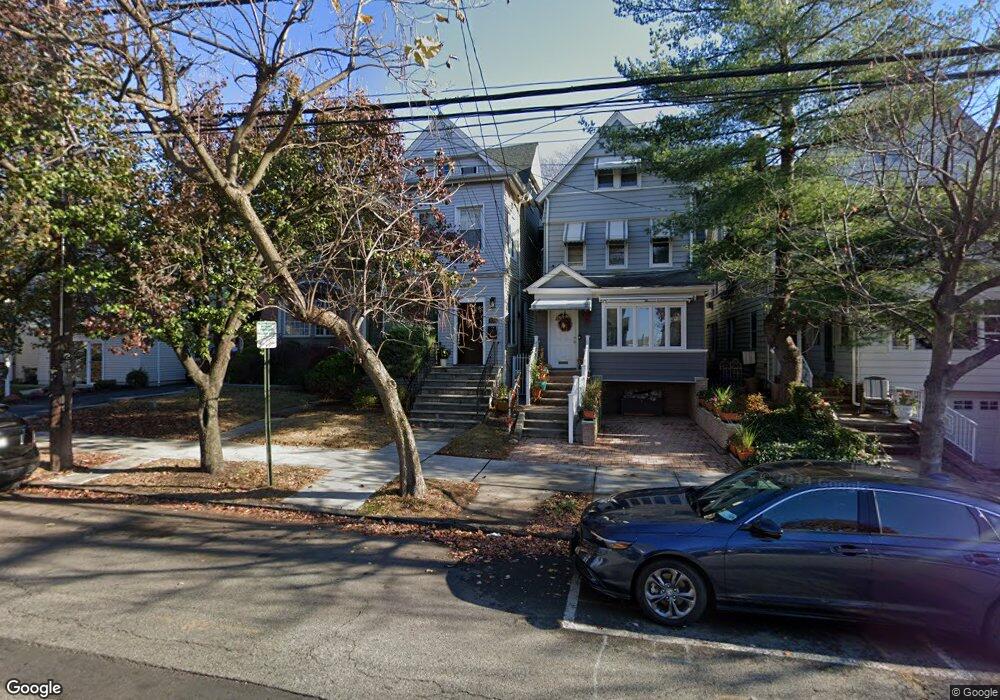
938 Avenue C Unit 1 Bayonne, NJ 07002
North Bayonne NeighborhoodEstimated Value: $509,000 - $878,000
2
Beds
1
Bath
1,400
Sq Ft
$509/Sq Ft
Est. Value
About This Home
This home is located at 938 Avenue C Unit 1, Bayonne, NJ 07002 and is currently estimated at $712,997, approximately $509 per square foot. 938 Avenue C Unit 1 is a home located in Hudson County with nearby schools including Bayonne High School and Yeshiva Gedolah of Bayonne.
Ownership History
Date
Name
Owned For
Owner Type
Purchase Details
Closed on
Sep 7, 2011
Sold by
Lagreca Salvatore
Bought by
Caraballo Jose and Caraballo Beverly
Current Estimated Value
Home Financials for this Owner
Home Financials are based on the most recent Mortgage that was taken out on this home.
Original Mortgage
$184,208
Outstanding Balance
$126,084
Interest Rate
4.25%
Mortgage Type
FHA
Estimated Equity
$586,913
Create a Home Valuation Report for This Property
The Home Valuation Report is an in-depth analysis detailing your home's value as well as a comparison with similar homes in the area
Home Values in the Area
Average Home Value in this Area
Purchase History
| Date | Buyer | Sale Price | Title Company |
|---|---|---|---|
| Caraballo Jose | $189,000 | -- |
Source: Public Records
Mortgage History
| Date | Status | Borrower | Loan Amount |
|---|---|---|---|
| Open | Caraballo Jose | $184,208 |
Source: Public Records
Tax History Compared to Growth
Tax History
| Year | Tax Paid | Tax Assessment Tax Assessment Total Assessment is a certain percentage of the fair market value that is determined by local assessors to be the total taxable value of land and additions on the property. | Land | Improvement |
|---|---|---|---|---|
| 2025 | $12,350 | $441,700 | $179,900 | $261,800 |
| 2024 | $11,851 | $441,700 | $179,900 | $261,800 |
| 2023 | $11,851 | $441,700 | $179,900 | $261,800 |
| 2022 | $11,630 | $441,700 | $179,900 | $261,800 |
| 2021 | $11,537 | $441,700 | $179,900 | $261,800 |
| 2020 | $11,334 | $441,700 | $179,900 | $261,800 |
| 2019 | $11,245 | $130,300 | $76,500 | $53,800 |
| 2018 | $11,021 | $130,300 | $76,500 | $53,800 |
| 2017 | $10,735 | $130,300 | $76,500 | $53,800 |
| 2016 | $10,339 | $130,300 | $76,500 | $53,800 |
| 2015 | $9,999 | $130,300 | $76,500 | $53,800 |
| 2014 | $11,488 | $154,300 | $76,500 | $77,800 |
Source: Public Records
Map
Nearby Homes