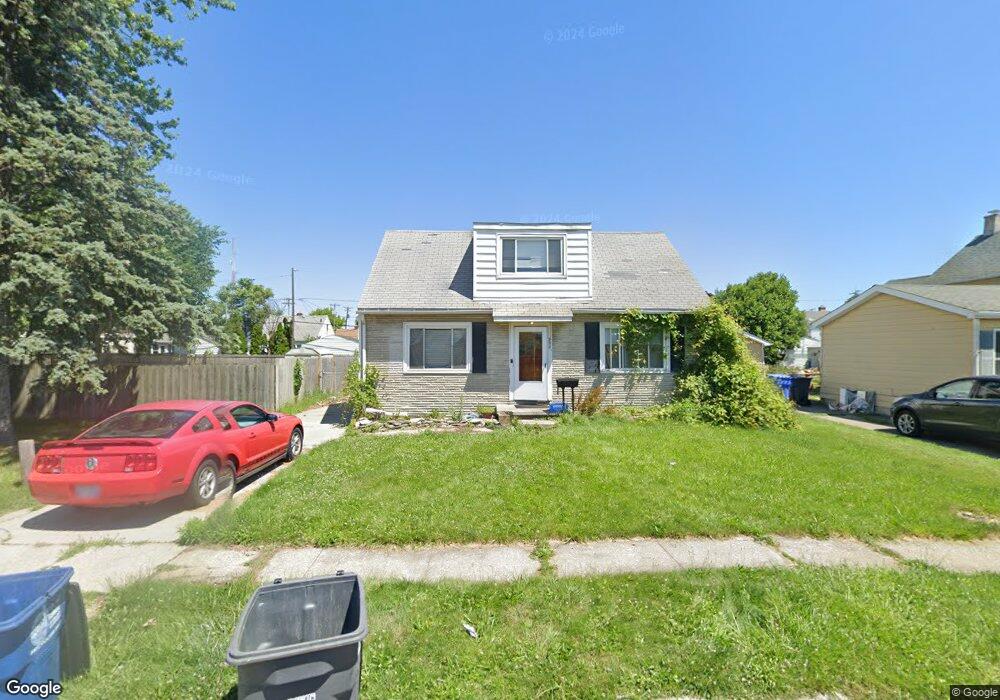
938 Custer Dr Toledo, OH 43612
North Towne NeighborhoodEstimated Value: $157,000 - $173,000
4
Beds
1
Bath
1,548
Sq Ft
$106/Sq Ft
Est. Value
About This Home
This home is located at 938 Custer Dr, Toledo, OH 43612 and is currently estimated at $163,908, approximately $105 per square foot. 938 Custer Dr is a home located in Lucas County with nearby schools including Larchmont Elementary School, Start High School, and Bennett Venture Academy.
Ownership History
Date
Name
Owned For
Owner Type
Purchase Details
Closed on
May 10, 2017
Sold by
Danchan Holdings Lp
Bought by
Kerenster Llc
Current Estimated Value
Purchase Details
Closed on
Dec 7, 2016
Sold by
Moody James
Bought by
Danchan Holdings L P
Home Financials for this Owner
Home Financials are based on the most recent Mortgage that was taken out on this home.
Original Mortgage
$38,000
Interest Rate
3.57%
Mortgage Type
Purchase Money Mortgage
Purchase Details
Closed on
Oct 5, 2016
Sold by
Smyth Bernad F and Kapszukiewicz Wade
Bought by
Moody James
Purchase Details
Closed on
Jun 2, 2000
Sold by
Smyth Martha A
Bought by
Smyth Bernard F and Smyth Dianne L
Home Financials for this Owner
Home Financials are based on the most recent Mortgage that was taken out on this home.
Original Mortgage
$47,500
Interest Rate
8.14%
Purchase Details
Closed on
May 1, 1992
Sold by
Thomas Carol J
Create a Home Valuation Report for This Property
The Home Valuation Report is an in-depth analysis detailing your home's value as well as a comparison with similar homes in the area
Home Values in the Area
Average Home Value in this Area
Purchase History
| Date | Buyer | Sale Price | Title Company |
|---|---|---|---|
| Kerenster Llc | $612,000 | None Available | |
| Danchan Holdings L P | -- | None Available | |
| Moody James | $15,000 | None Available | |
| Smyth Bernard F | -- | Prospect Title Agency Inc | |
| -- | $58,900 | -- |
Source: Public Records
Mortgage History
| Date | Status | Borrower | Loan Amount |
|---|---|---|---|
| Previous Owner | Danchan Holdings L P | $38,000 | |
| Previous Owner | Smyth Bernard F | $47,500 |
Source: Public Records
Tax History Compared to Growth
Tax History
| Year | Tax Paid | Tax Assessment Tax Assessment Total Assessment is a certain percentage of the fair market value that is determined by local assessors to be the total taxable value of land and additions on the property. | Land | Improvement |
|---|---|---|---|---|
| 2024 | $2,565 | $39,270 | $5,775 | $33,495 |
| 2023 | $2,274 | $34,930 | $5,110 | $29,820 |
| 2022 | $2,276 | $34,930 | $5,110 | $29,820 |
| 2021 | $2,332 | $34,930 | $5,110 | $29,820 |
| 2020 | $2,207 | $29,120 | $4,270 | $24,850 |
| 2019 | $2,149 | $29,120 | $4,270 | $24,850 |
| 2018 | $2,157 | $29,120 | $4,270 | $24,850 |
| 2017 | $2,051 | $26,215 | $6,055 | $20,160 |
| 2016 | $8,829 | $74,900 | $17,300 | $57,600 |
| 2015 | $1,985 | $74,900 | $17,300 | $57,600 |
| 2014 | $2,476 | $26,220 | $6,060 | $20,160 |
| 2013 | $1,650 | $26,220 | $6,060 | $20,160 |
Source: Public Records
Map
Nearby Homes
- 943 Cloverdale Rd
- 741 Cloverdale Rd
- 5061 Hallgate Ave
- 1126 Slater St
- 5145 Ford Ave
- 826 W Gramercy Ave
- 702 Mayfair Blvd
- 1044 Hawk St
- 4912 Burnham Ave
- 904 Annabelle Dr
- 927 W Northgate Pkwy
- 743 W Gramercy Ave
- 706 W Gramercy Ave
- 535 Waybridge Rd
- 5404 Lewis Ave
- 5053 Bennett Rd
- 613 W Poinsetta Ave
- 4703 Vermaas Ave
- 4623 Lewis Ave
- 829 Brinton Dr
- 944 Custer Dr
- 934 Custer Dr
- 948 Custer Dr
- 928 Custer Dr
- 933 Southover Rd
- 929 Southover Rd
- 937 Southover Rd
- 925 Southover Rd
- 941 Southover Rd
- 945 Southover Rd
- 937 Custer Dr
- 929 Custer Dr
- 943 Custer Dr
- 920 Custer Dr
- 917 Southover Rd
- 5054 Lewis Ave
- 5062 Lewis Ave
- 947 Custer Dr
- 927 Custer Dr
- 913 Southover Rd