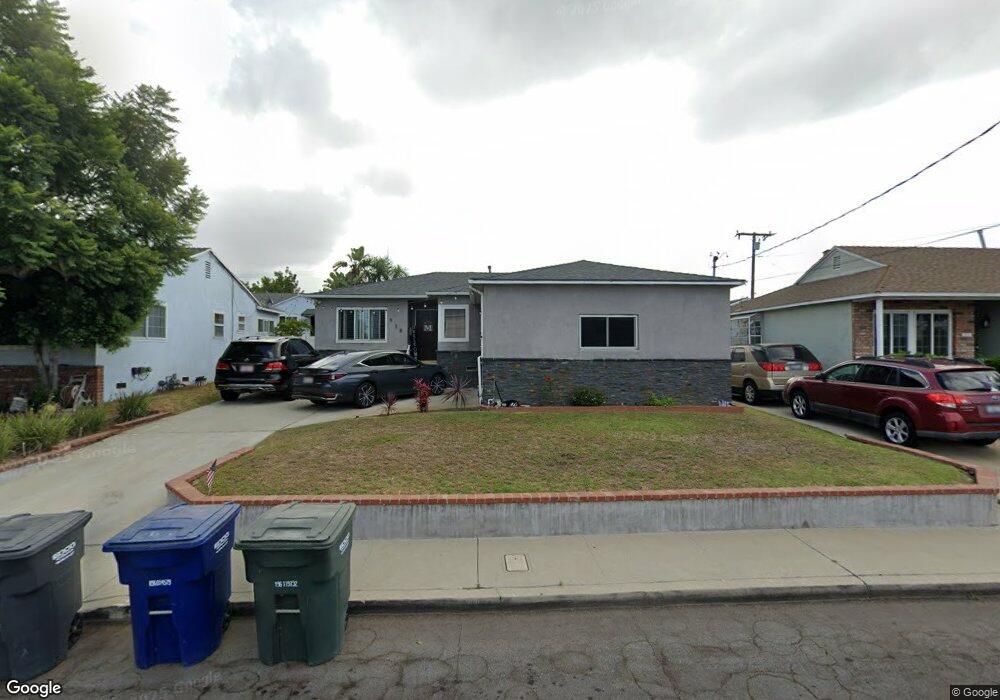
938 Cypress St El Segundo, CA 90245
El Segundo AreaEstimated Value: $1,503,000 - $1,742,000
About This Home
This home is located at 938 Cypress St, El Segundo, CA 90245 and is currently estimated at $1,644,189, approximately $1,093 per square foot. 938 Cypress St is a home located in Los Angeles County with nearby schools including Center Street Elementary, El Segundo Middle School, and El Segundo High School.
Ownership History
We collect this data history from publicly available records. To have your information removed, we recommend requesting removal directly through your county’s website.
Purchase Details
Purchase Details
Home Values in the Area
Average Home Value in this Area
Purchase History
We collect this data history from publicly available records. To have your information removed, we recommend requesting removal directly through your county’s website.
| Date | Buyer | Sale Price | Title Company |
|---|---|---|---|
| -- | None Listed On Document | ||
| $298,500 | Gateway Title Company |
Mortgage History
We collect this data history from publicly available records. To have your information removed, we recommend requesting removal directly through your county’s website.
| Date | Status | Borrower | Loan Amount |
|---|---|---|---|
| Previous Owner | $351,700 | ||
| Previous Owner | $100,000 | ||
| Previous Owner | $410,000 | ||
| Previous Owner | $420,000 | ||
| Previous Owner | $350,000 | ||
| Previous Owner | $70,000 | ||
| Previous Owner | $304,000 |
Tax History
We collect this data history from publicly available records. To have your information removed, we recommend requesting removal directly through your county’s website.
| Year | Tax Paid | Tax Assessment Tax Assessment Total Assessment is a certain percentage of the fair market value that is determined by local assessors to be the total taxable value of land and additions on the property. | Land | Improvement |
|---|---|---|---|---|
| 2025 | $5,898 | $513,706 | $374,360 | $139,346 |
| 2024 | $5,745 | $503,634 | $367,020 | $136,614 |
| 2023 | $5,598 | $493,760 | $359,824 | $133,936 |
| 2022 | $5,656 | $484,079 | $352,769 | $131,310 |
| 2021 | $5,575 | $474,588 | $345,852 | $128,736 |
| 2019 | $5,386 | $460,513 | $335,595 | $124,918 |
| 2018 | $5,003 | $451,484 | $329,015 | $122,469 |
| 2016 | $4,849 | $433,954 | $316,240 | $117,714 |
| 2015 | $4,788 | $427,436 | $311,490 | $115,946 |
| 2014 | $4,691 | $419,064 | $305,389 | $113,675 |
Map
- 861 Sheldon St
- 944 Sheldon St
- 212 E Imperial Ave Unit A
- 212 E Imperial Ave Unit E
- 203 E Sycamore Ave
- 121 E Walnut Ave
- 745 Penn St
- 906 E Imperial Ave
- 929 Lomita St
- 935 Main St
- 123 E Oak Ave Unit 306
- 1029 E Acacia Ave
- 825 Bungalow Dr
- 124 W Sycamore Ave
- 865 Center St
- 628 Penn St
- 219 W Acacia Ave
- 703 Main St Unit 2
- 624 Sierra St
- 1112 E Imperial Ave
- 917 Sheldon St
- 913 Sheldon St
- 925 Sheldon St
- 929 Sheldon St
- 922 Cypress St
- 909 Sheldon St
- 914 Cypress St
- 930 Cypress St
- 933 Sheldon St
- 419 E Walnut Ave
- 425 E Walnut Ave
- 922 Sheldon St
- 916 Sheldon St
- 407 E Walnut Ave
- 926 Sheldon St
- 934 Cypress St
- 912 Sheldon St
- 908 Sheldon St
- 937 Sheldon St
- 928 Sheldon St
Ask me questions while you tour the home.