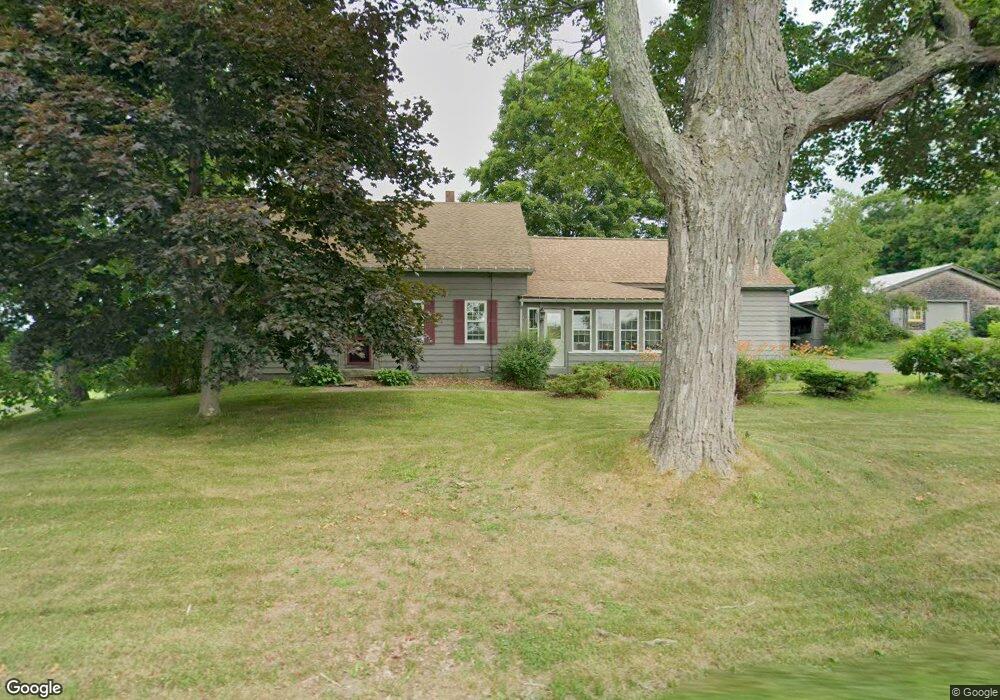
938 Garland Rd Winslow, ME 04901
Estimated Value: $365,000 - $407,000
5
Beds
3
Baths
2,177
Sq Ft
$179/Sq Ft
Est. Value
About This Home
This home is located at 938 Garland Rd, Winslow, ME 04901 and is currently estimated at $389,327, approximately $178 per square foot. 938 Garland Rd is a home located in Kennebec County with nearby schools including Winslow Elementary School, Winslow Junior High School, and Winslow High School.
Ownership History
Date
Name
Owned For
Owner Type
Purchase Details
Closed on
May 5, 2017
Sold by
Mcintire Walter G
Bought by
Mcintire Jay A
Current Estimated Value
Purchase Details
Closed on
Apr 24, 2007
Sold by
Smith Phillip H Est
Bought by
Mcintire Joyce L and Mcintire Walter G
Home Financials for this Owner
Home Financials are based on the most recent Mortgage that was taken out on this home.
Original Mortgage
$100,000
Interest Rate
6.19%
Mortgage Type
Purchase Money Mortgage
Create a Home Valuation Report for This Property
The Home Valuation Report is an in-depth analysis detailing your home's value as well as a comparison with similar homes in the area
Home Values in the Area
Average Home Value in this Area
Purchase History
| Date | Buyer | Sale Price | Title Company |
|---|---|---|---|
| Mcintire Jay A | -- | -- | |
| Mcintire Joyce L | -- | -- |
Source: Public Records
Mortgage History
| Date | Status | Borrower | Loan Amount |
|---|---|---|---|
| Closed | Mcintire Joyce L | $100,000 |
Source: Public Records
Tax History Compared to Growth
Tax History
| Year | Tax Paid | Tax Assessment Tax Assessment Total Assessment is a certain percentage of the fair market value that is determined by local assessors to be the total taxable value of land and additions on the property. | Land | Improvement |
|---|---|---|---|---|
| 2024 | $5,148 | $343,200 | $38,900 | $304,300 |
| 2023 | $5,148 | $343,200 | $38,900 | $304,300 |
| 2022 | $3,572 | $192,800 | $26,500 | $166,300 |
| 2021 | $3,369 | $191,800 | $26,500 | $165,300 |
| 2020 | $2,438 | $191,800 | $26,500 | $165,300 |
| 2019 | $1,275 | $191,800 | $26,500 | $165,300 |
| 2018 | $3,441 | $191,800 | $26,500 | $165,300 |
| 2017 | $2,377 | $191,800 | $26,500 | $165,300 |
| 2016 | $3,019 | $191,800 | $26,500 | $165,300 |
| 2015 | $2,981 | $192,300 | $27,000 | $165,300 |
| 2014 | $2,981 | $192,300 | $27,000 | $165,300 |
Source: Public Records
Map
Nearby Homes
- 137 Heywood Rd
- 0 Olde Heritage Map 10 Lot 77-3 Place Unit 1628289
- 329 Neck Rd
- 199 Neck Rd
- Lot 4 Peachtree Ln
- 17 Hapworth Ln
- 3 Bunker Ave
- 35 Bangor Rd
- 670 Benton Ave Unit 8
- 2 Gibson St
- 24 Meadow View Ln
- 436 N Pond Rd
- 2 Blue Heron Ln
- 3 Blue Heron Ln
- 2 and 3 Blue Heron Ln
- 5 Chickadee Trail Unit 5
- 2 Whippoorwill Dr Unit 35
- 22 Burrill St
- 158 Clinton Ave
- 21 Cardinal Way