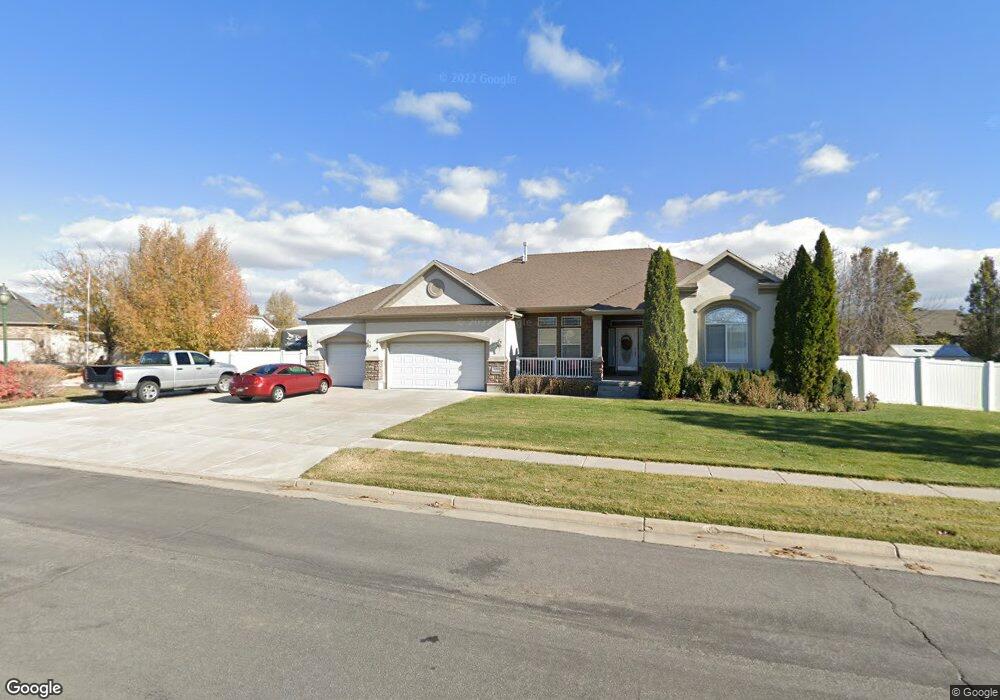
938 N 3550 W Layton, UT 84041
Estimated Value: $731,000 - $748,000
3
Beds
3
Baths
2,414
Sq Ft
$307/Sq Ft
Est. Value
About This Home
This home is located at 938 N 3550 W, Layton, UT 84041 and is currently estimated at $742,167, approximately $307 per square foot. 938 N 3550 W is a home located in Davis County with nearby schools including Sand Springs Elementary School, Legacy Junior High School, and Layton High School.
Ownership History
Date
Name
Owned For
Owner Type
Purchase Details
Closed on
Dec 23, 2004
Sold by
North Ivory
Bought by
Palmer Dean L and Palmer Catherine J
Current Estimated Value
Home Financials for this Owner
Home Financials are based on the most recent Mortgage that was taken out on this home.
Original Mortgage
$270,924
Interest Rate
5.16%
Mortgage Type
Purchase Money Mortgage
Create a Home Valuation Report for This Property
The Home Valuation Report is an in-depth analysis detailing your home's value as well as a comparison with similar homes in the area
Home Values in the Area
Average Home Value in this Area
Purchase History
| Date | Buyer | Sale Price | Title Company |
|---|---|---|---|
| Palmer Dean L | -- | Cottonwood Title Ins Agency |
Source: Public Records
Mortgage History
| Date | Status | Borrower | Loan Amount |
|---|---|---|---|
| Closed | Palmer Dean L | $270,924 |
Source: Public Records
Tax History Compared to Growth
Tax History
| Year | Tax Paid | Tax Assessment Tax Assessment Total Assessment is a certain percentage of the fair market value that is determined by local assessors to be the total taxable value of land and additions on the property. | Land | Improvement |
|---|---|---|---|---|
| 2025 | $3,642 | $382,250 | $134,963 | $247,287 |
| 2024 | $3,662 | $387,200 | $143,895 | $243,305 |
| 2023 | $3,584 | $668,000 | $153,397 | $514,603 |
| 2022 | $3,798 | $384,450 | $88,525 | $295,925 |
| 2021 | $3,458 | $522,000 | $132,761 | $389,239 |
| 2020 | $3,121 | $452,000 | $113,644 | $338,356 |
| 2019 | $2,996 | $425,000 | $111,829 | $313,171 |
| 2018 | $2,788 | $397,000 | $98,604 | $298,396 |
| 2016 | $2,591 | $190,301 | $41,201 | $149,100 |
| 2015 | $2,617 | $182,491 | $41,201 | $141,290 |
| 2014 | $2,230 | $158,986 | $41,201 | $117,785 |
| 2013 | -- | $167,990 | $38,634 | $129,356 |
Source: Public Records
Map
Nearby Homes