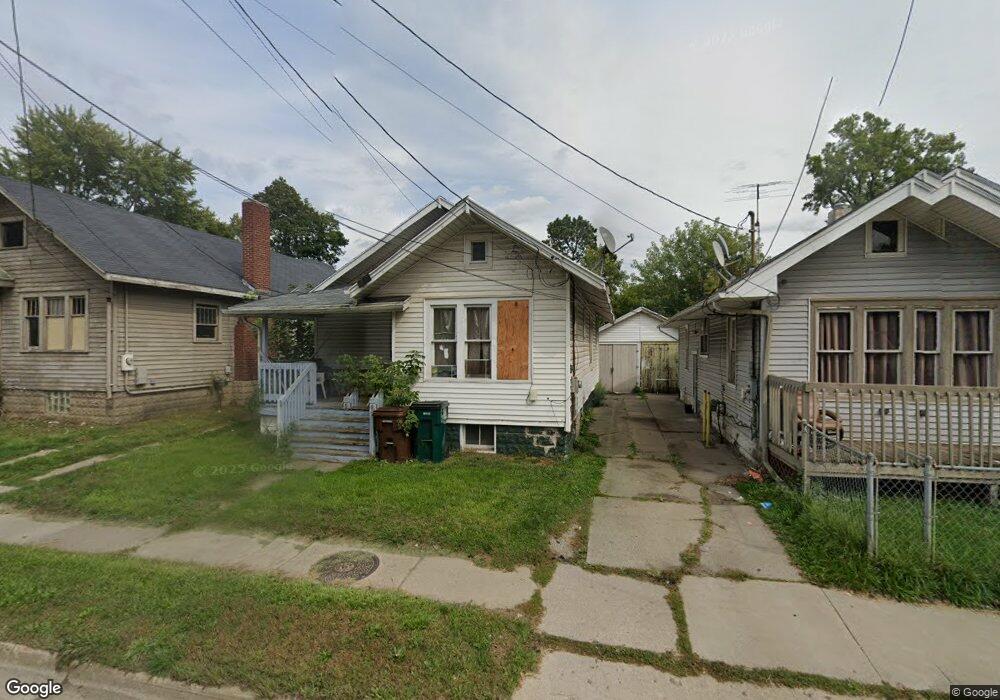
938 N Martin Luther King jr Blvd Lansing, MI 48915
Old Forest NeighborhoodEstimated Value: $72,000 - $89,000
2
Beds
1
Bath
800
Sq Ft
$101/Sq Ft
Est. Value
About This Home
This home is located at 938 N Martin Luther King jr Blvd, Lansing, MI 48915 and is currently estimated at $80,409, approximately $100 per square foot. 938 N Martin Luther King jr Blvd is a home located in Ingham County with nearby schools including Willow School, Pattengill Academy, and J.W. Sexton High School.
Ownership History
Date
Name
Owned For
Owner Type
Purchase Details
Closed on
Jun 19, 2008
Sold by
Opanasenko Terry
Bought by
North Mlk Llc
Current Estimated Value
Purchase Details
Closed on
Jan 25, 2007
Sold by
Morris Opherine
Bought by
Um Capital Llc
Purchase Details
Closed on
Mar 13, 2003
Sold by
Morris Opherine
Bought by
Hobbs Melinda
Purchase Details
Closed on
Oct 18, 2001
Sold by
Morris Opherine
Bought by
Hobbs Melinda
Home Financials for this Owner
Home Financials are based on the most recent Mortgage that was taken out on this home.
Original Mortgage
$42,459
Interest Rate
6.69%
Mortgage Type
Seller Take Back
Purchase Details
Closed on
Dec 29, 1997
Sold by
Bibbs Willie L and Morris Opherine
Bought by
Morris Opherine
Create a Home Valuation Report for This Property
The Home Valuation Report is an in-depth analysis detailing your home's value as well as a comparison with similar homes in the area
Home Values in the Area
Average Home Value in this Area
Purchase History
| Date | Buyer | Sale Price | Title Company |
|---|---|---|---|
| North Mlk Llc | -- | None Available | |
| Um Capital Llc | $28,000 | None Available | |
| Hobbs Melinda | -- | -- | |
| Hobbs Melinda | $42,459 | -- | |
| Morris Opherine | -- | -- |
Source: Public Records
Mortgage History
| Date | Status | Borrower | Loan Amount |
|---|---|---|---|
| Previous Owner | Hobbs Melinda | $42,459 |
Source: Public Records
Tax History Compared to Growth
Tax History
| Year | Tax Paid | Tax Assessment Tax Assessment Total Assessment is a certain percentage of the fair market value that is determined by local assessors to be the total taxable value of land and additions on the property. | Land | Improvement |
|---|---|---|---|---|
| 2025 | $1,886 | $32,600 | $4,000 | $28,600 |
| 2024 | $15 | $32,200 | $4,000 | $28,200 |
| 2023 | $2,002 | $28,800 | $4,000 | $24,800 |
| 2022 | $1,625 | $26,800 | $3,700 | $23,100 |
| 2021 | $1,588 | $24,500 | $2,600 | $21,900 |
| 2020 | $1,651 | $21,400 | $2,600 | $18,800 |
| 2019 | $2,715 | $20,000 | $2,600 | $17,400 |
| 2018 | $1,444 | $18,400 | $2,600 | $15,800 |
| 2017 | $1,389 | $18,400 | $2,600 | $15,800 |
| 2016 | $2,568 | $18,100 | $2,600 | $15,500 |
| 2015 | $2,568 | $17,500 | $5,112 | $12,388 |
| 2014 | $2,568 | $18,200 | $9,500 | $8,700 |
Source: Public Records
Map
Nearby Homes
- 933 N Martin Luther King Junior Blvd
- 1019 Daleford St
- 908 Clyde St
- 814 N Martin Luther King jr Blvd
- 820 Princeton Ave
- 806 Princeton Ave
- 1129 N Martin Luther King jr Blvd
- 754 Princeton Ave
- 751 Chicago Ave
- 1300 W Maple St
- 1310 W Maple St
- 705 Princeton Ave
- 921 N Sycamore St
- 1224 Theodore St
- 751 Westmoreland Ave
- 624 Brook St
- 1217 W Saginaw St
- 1221 W Saginaw St
- 1225 W Saginaw St
- 1229 W Saginaw St
- 938 N Mlk Blvd
- 934 N Martin Luther King jr Blvd
- 934 N Mlk Blvd
- 940 N Mlk Blvd
- 934 N Martin Luther King Junior Blvd
- 1014 Daleford St
- 944 N Mlk Blvd
- 946 N Mlk Blvd
- 926 N Martin Luther King jr Blvd
- 926 N Mlk Blvd
- 1000 N Mlk Blvd
- 935 Princeton Ave
- 933 N Mlk Blvd
- 935 N Mlk Blvd
- 939 Princeton Ave
- 922 N Mlk Blvd
- 922 N Martin Luther King jr Blvd
- 922 N Martin Luther King Junior Blvd
- 931 N Mlk Blvd
- 943 Princeton Ave