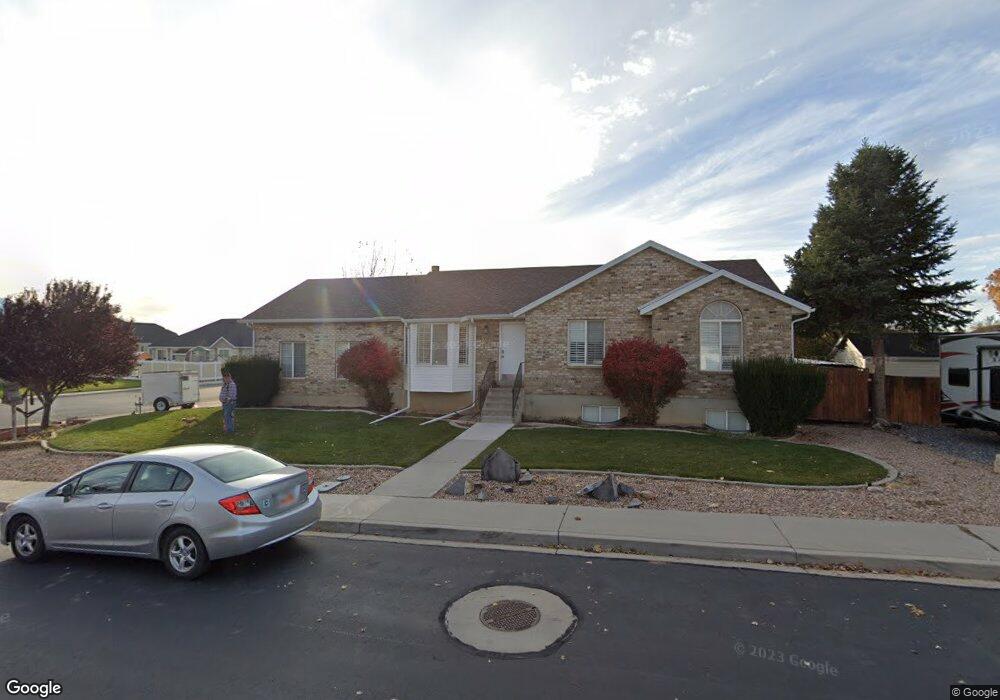
938 S 1560 E Spanish Fork, UT 84660
Estimated Value: $510,000 - $544,000
5
Beds
3
Baths
2,422
Sq Ft
$217/Sq Ft
Est. Value
About This Home
This home is located at 938 S 1560 E, Spanish Fork, UT 84660 and is currently estimated at $525,648, approximately $217 per square foot. 938 S 1560 E is a home located in Utah County with nearby schools including Canyon Elementary School, Spanish Fork Jr High School, and Spanish Fork High School.
Ownership History
Date
Name
Owned For
Owner Type
Purchase Details
Closed on
Jul 19, 2024
Sold by
Rucker Jason D and Rucker Jill H
Bought by
Rucker Family Trust and Rucker
Current Estimated Value
Purchase Details
Closed on
Apr 28, 2003
Sold by
Rucker Jason D and Rucker Jill H
Bought by
Rucker Jason D and Rucker Jill
Home Financials for this Owner
Home Financials are based on the most recent Mortgage that was taken out on this home.
Original Mortgage
$111,400
Interest Rate
5.72%
Mortgage Type
Purchase Money Mortgage
Purchase Details
Closed on
Nov 27, 1996
Sold by
Falcon Builders
Bought by
Rucker Jason D and Rucker Jill H
Home Financials for this Owner
Home Financials are based on the most recent Mortgage that was taken out on this home.
Original Mortgage
$114,750
Interest Rate
7.91%
Create a Home Valuation Report for This Property
The Home Valuation Report is an in-depth analysis detailing your home's value as well as a comparison with similar homes in the area
Home Values in the Area
Average Home Value in this Area
Purchase History
| Date | Buyer | Sale Price | Title Company |
|---|---|---|---|
| Rucker Family Trust | -- | Wasatch Land & Title | |
| Rucker Jason D | -- | Inwest Title Services Inc | |
| Rucker Jason D | -- | -- |
Source: Public Records
Mortgage History
| Date | Status | Borrower | Loan Amount |
|---|---|---|---|
| Previous Owner | Rucker Jason D | $111,400 | |
| Previous Owner | Rucker Jason D | $114,750 |
Source: Public Records
Tax History
| Year | Tax Paid | Tax Assessment Tax Assessment Total Assessment is a certain percentage of the fair market value that is determined by local assessors to be the total taxable value of land and additions on the property. | Land | Improvement |
|---|---|---|---|---|
| 2025 | $2,392 | $270,875 | -- | -- |
| 2024 | $2,392 | $246,510 | $0 | $0 |
| 2023 | $2,418 | $249,535 | $0 | $0 |
| 2022 | $2,452 | $248,160 | $0 | $0 |
| 2021 | $2,073 | $335,600 | $119,200 | $216,400 |
| 2020 | $1,962 | $308,800 | $108,400 | $200,400 |
| 2019 | $1,743 | $288,600 | $90,300 | $198,300 |
| 2018 | $1,609 | $257,600 | $85,200 | $172,400 |
| 2017 | $1,539 | $132,385 | $0 | $0 |
| 2016 | $1,460 | $123,970 | $0 | $0 |
| 2015 | $1,402 | $117,590 | $0 | $0 |
| 2014 | $1,275 | $107,360 | $0 | $0 |
Source: Public Records
Map
Nearby Homes
- 2308 E 850 South St Unit 10
- 938 S 1740 E
- 232 E 860 S Unit 158
- 1147 S 1660 E
- 857 S 1300 E Unit 32
- 857 S 1300 E
- 815 S 1300 E Unit 34
- 762 S 1360 E
- 762 S 1360 E Unit 25
- 789 S 1300 E
- 834 S 1300 #16gc E
- 816 S 1300 #15gc E
- 1878 E 1050 S
- 1025 S 3100 E Unit 320
- 1166 S 1920 E
- 2044 E 800 S
- 357 E 1460 S Unit 45
- 385 E 1460 S Unit 47
- 1658 Dover Dr
- 1330 E 410 S
Your Personal Tour Guide
Ask me questions while you tour the home.