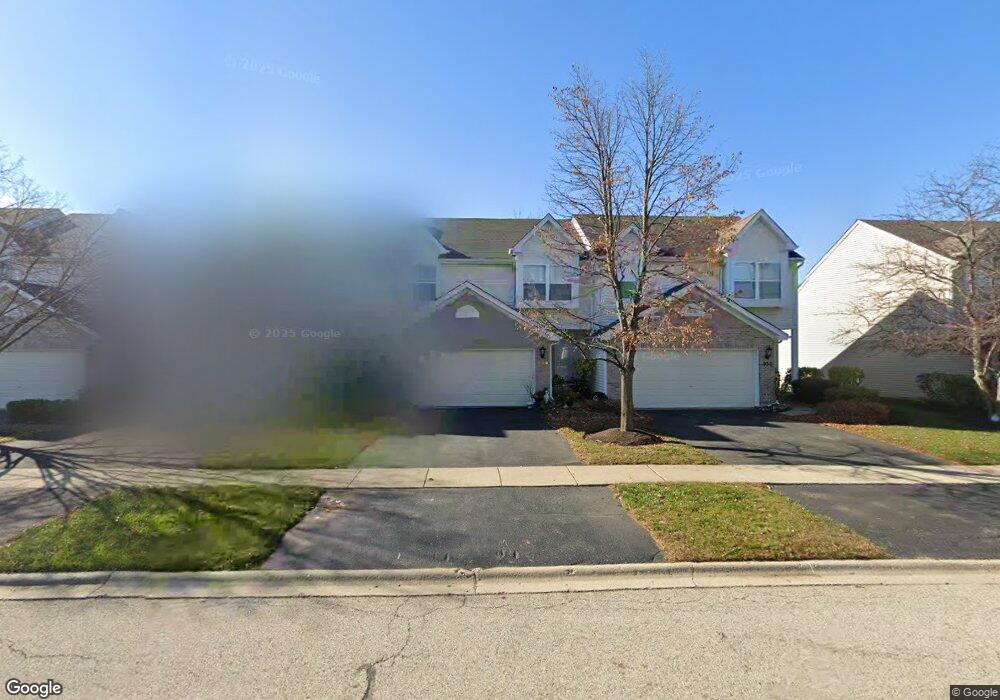
938 Viewpoint Dr Lake In the Hills, IL 60156
Estimated Value: $268,000 - $288,000
2
Beds
2
Baths
1,735
Sq Ft
$159/Sq Ft
Est. Value
About This Home
This home is located at 938 Viewpoint Dr, Lake In the Hills, IL 60156 and is currently estimated at $275,764, approximately $158 per square foot. 938 Viewpoint Dr is a home located in McHenry County with nearby schools including Westfield Community School, Lake in the Hills Elementary School, and United Junior High School.
Ownership History
Date
Name
Owned For
Owner Type
Purchase Details
Closed on
Mar 28, 2001
Sold by
Karmis Nicholas and Karmis Charlene
Bought by
Seo Jin S
Current Estimated Value
Home Financials for this Owner
Home Financials are based on the most recent Mortgage that was taken out on this home.
Original Mortgage
$142,000
Outstanding Balance
$52,464
Interest Rate
7.05%
Estimated Equity
$223,300
Purchase Details
Closed on
Aug 18, 2000
Sold by
Panek Joseph M and Panek Michelle L
Bought by
Karmis Nicholas
Home Financials for this Owner
Home Financials are based on the most recent Mortgage that was taken out on this home.
Original Mortgage
$135,850
Interest Rate
8.16%
Purchase Details
Closed on
Jun 16, 1995
Sold by
Windmere Cove Partners Inc
Bought by
Panek Joseph M and Panek Michelle A
Home Financials for this Owner
Home Financials are based on the most recent Mortgage that was taken out on this home.
Original Mortgage
$108,600
Interest Rate
7.5%
Create a Home Valuation Report for This Property
The Home Valuation Report is an in-depth analysis detailing your home's value as well as a comparison with similar homes in the area
Home Values in the Area
Average Home Value in this Area
Purchase History
| Date | Buyer | Sale Price | Title Company |
|---|---|---|---|
| Seo Jin S | $149,500 | Attorneys Title Guaranty Fun | |
| Karmis Nicholas | $143,000 | Universal Title Services Inc | |
| Panek Joseph M | $121,000 | Chicago Title |
Source: Public Records
Mortgage History
| Date | Status | Borrower | Loan Amount |
|---|---|---|---|
| Open | Seo Jin S | $142,000 | |
| Previous Owner | Karmis Nicholas | $135,850 | |
| Previous Owner | Panek Joseph M | $108,600 |
Source: Public Records
Tax History Compared to Growth
Tax History
| Year | Tax Paid | Tax Assessment Tax Assessment Total Assessment is a certain percentage of the fair market value that is determined by local assessors to be the total taxable value of land and additions on the property. | Land | Improvement |
|---|---|---|---|---|
| 2024 | $2,863 | $81,515 | $15,727 | $65,788 |
| 2023 | $3,073 | $72,905 | $14,066 | $58,839 |
| 2022 | $3,611 | $65,169 | $12,695 | $52,474 |
| 2021 | $3,745 | $60,713 | $11,827 | $48,886 |
| 2020 | $3,797 | $58,563 | $11,408 | $47,155 |
| 2019 | $3,900 | $56,052 | $10,919 | $45,133 |
| 2018 | $4,565 | $51,780 | $10,087 | $41,693 |
| 2017 | $4,461 | $48,780 | $9,503 | $39,277 |
| 2016 | $4,378 | $45,751 | $8,913 | $36,838 |
| 2013 | -- | $49,264 | $8,315 | $40,949 |
Source: Public Records
Map
Nearby Homes
- 937 Mesa Dr
- 900 Windstone Ct
- 809 Menominee Dr
- 807 Menominee Dr
- 909 Roger St
- 7 Michael Ct
- 16 Brian Ct
- LOT 3 Blackhawk Dr
- 266 Grandview Ct
- 992 Mcphee Dr
- 1431 Essex St
- 1049 Horizon Ridge
- Lots 10 & 11 Ramble Rd
- 70 Hilltop Dr Unit 4
- 721 Brentwood Ct
- 1019 Maple St
- 135 Arquilla Dr
- 1235 Fairmont Ct
- 1345 Cunat Ct Unit 1B
- 1345 Cunat Ct Unit 2D
- 940 Viewpoint Dr
- 936 Viewpoint Dr
- 942 Viewpoint Dr
- 934 Viewpoint Dr
- 944 Viewpoint Dr
- 932 Viewpoint Dr
- 930 Viewpoint Dr
- 946 Viewpoint Dr
- 939 Viewpoint Dr
- 948 Viewpoint Dr
- 937 Viewpoint Dr
- 941 Viewpoint Dr
- 941 Viewpoint Dr Unit 941
- 943 Viewpoint Dr
- 933 Viewpoint Dr
- 945 Viewpoint Dr
- 926 Viewpoint Dr
- 950 Viewpoint Dr
- 947 Viewpoint Dr
- 931 Viewpoint Dr