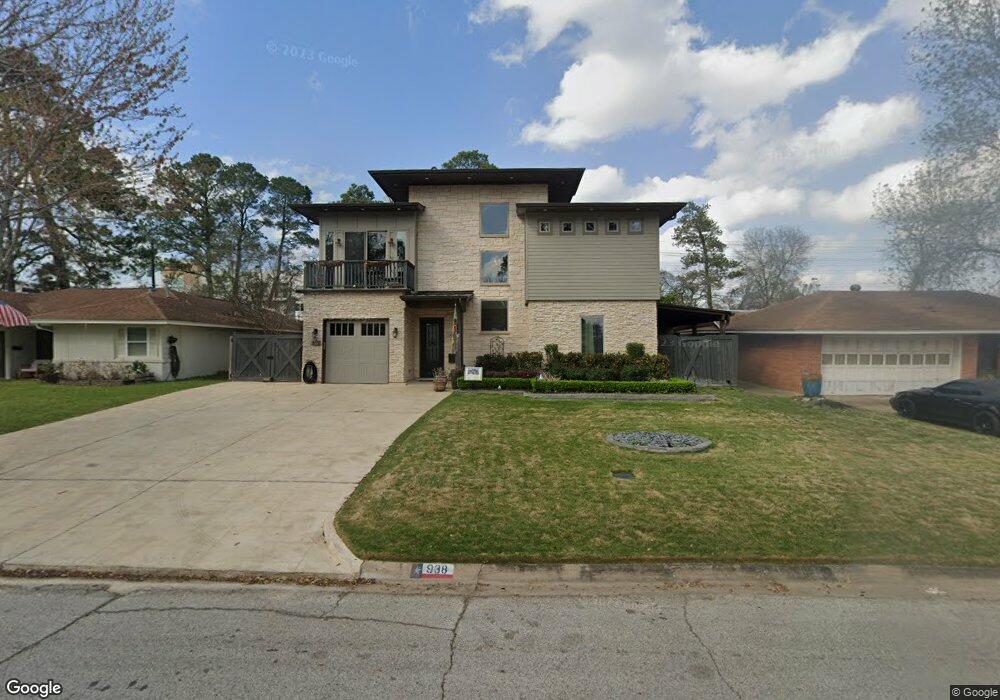
938 W 31st St Houston, TX 77018
Oak Forest-Garden Oaks NeighborhoodEstimated Value: $308,000 - $1,078,000
3
Beds
3
Baths
2,880
Sq Ft
$255/Sq Ft
Est. Value
About This Home
This home is located at 938 W 31st St, Houston, TX 77018 and is currently estimated at $733,021, approximately $254 per square foot. 938 W 31st St is a home located in Harris County with nearby schools including Garden Oaks Montessori, Frank Black Middle School, and Waltrip High School.
Ownership History
Date
Name
Owned For
Owner Type
Purchase Details
Closed on
Apr 22, 2024
Sold by
Seymour Lea Nichole
Bought by
Seymour Lea N and Aguilar Charles J
Current Estimated Value
Home Financials for this Owner
Home Financials are based on the most recent Mortgage that was taken out on this home.
Original Mortgage
$766,550
Outstanding Balance
$754,061
Interest Rate
6.74%
Mortgage Type
Credit Line Revolving
Estimated Equity
-$21,040
Purchase Details
Closed on
Jan 9, 2017
Sold by
Bolulwared Tracy
Bought by
Seymour Lea Nihole
Home Financials for this Owner
Home Financials are based on the most recent Mortgage that was taken out on this home.
Original Mortgage
$75,000
Interest Rate
4.13%
Mortgage Type
Purchase Money Mortgage
Purchase Details
Closed on
Nov 3, 2014
Sold by
Arnold Valentina Khalikova and Arnold Valentine Khalikova
Bought by
Boulware Tracy
Purchase Details
Closed on
Jul 6, 2012
Sold by
Smith Denise Sefcik
Bought by
Arnold Valentine Khalikova
Create a Home Valuation Report for This Property
The Home Valuation Report is an in-depth analysis detailing your home's value as well as a comparison with similar homes in the area
Home Values in the Area
Average Home Value in this Area
Purchase History
| Date | Buyer | Sale Price | Title Company |
|---|---|---|---|
| Seymour Lea N | -- | None Listed On Document | |
| Seymour Lea Nihole | -- | First American Title | |
| Boulware Tracy | -- | First American Title | |
| Arnold Valentine Khalikova | -- | None Available |
Source: Public Records
Mortgage History
| Date | Status | Borrower | Loan Amount |
|---|---|---|---|
| Open | Seymour Lea N | $766,550 | |
| Previous Owner | Seymour Lea Nihole | $75,000 | |
| Previous Owner | Seymour Lea Nihole | $408,000 |
Source: Public Records
Tax History Compared to Growth
Tax History
| Year | Tax Paid | Tax Assessment Tax Assessment Total Assessment is a certain percentage of the fair market value that is determined by local assessors to be the total taxable value of land and additions on the property. | Land | Improvement |
|---|---|---|---|---|
| 2025 | $10,762 | $721,386 | $283,760 | $437,626 |
| 2024 | $10,762 | $703,662 | $283,760 | $419,902 |
| 2023 | $10,762 | $630,541 | $248,290 | $382,251 |
| 2022 | $13,164 | $597,861 | $212,820 | $385,041 |
| 2021 | $13,052 | $560,023 | $177,350 | $382,673 |
| 2020 | $13,566 | $560,205 | $177,350 | $382,855 |
| 2019 | $14,176 | $560,205 | $177,350 | $382,855 |
| 2018 | $11,957 | $602,551 | $177,350 | $425,201 |
| 2017 | $15,236 | $602,551 | $177,350 | $425,201 |
| 2016 | $7,029 | $278,000 | $177,350 | $100,650 |
| 2015 | $4,390 | $271,139 | $177,350 | $93,789 |
| 2014 | $4,390 | $170,770 | $106,410 | $64,360 |
Source: Public Records
Map
Nearby Homes
- 3203 Garden Oaks View
- 1041 Gardendale Dr
- 822 W 31st St
- 1115 Gardendale Dr
- 811 Sara Rose St
- 1119 W 30th St
- 2653 Fountain Key Blvd
- 1121 Beall Landing Ct
- 1114 Beall Landing Ct
- 831 Wakefield Dr Unit A
- 765 Sue Barnett Dr
- 915 W 35th St Unit B
- 1137 W 26th St
- 1135 W 26th St Unit 5
- 717 Sue Barnett Dr
- 804 W 27th St
- 1226 Stonecrest Dr
- 2623 Shady Woods Ln
- 840 W 26th St
- 1128 W 26th St
- 934 W 31st St
- 942 W 31st St
- 930 W 31st St
- 946 W 31st St
- 939 W 31st St
- 935 W 31st St
- 943 W 31st St
- 926 W 31st St
- 931 W 31st St
- 947 W 31st St
- 927 W 31st St
- 1002 W 31
- 1002 W 31st St
- 901 Garden Oaks Terrace
- 903 Garden Oaks Terrace
- 835 Garden Oaks Terrace
- 833 Garden Oaks Terrace
- 907 Garden Oaks Terrace
- 905 Garden Oaks Terrace
- 938 Stonecrest Dr