938 W 330 S Logan, UT 84321
Woodruff NeighborhoodEstimated Value: $365,000 - $388,914
3
Beds
1
Bath
1,900
Sq Ft
$200/Sq Ft
Est. Value
About This Home
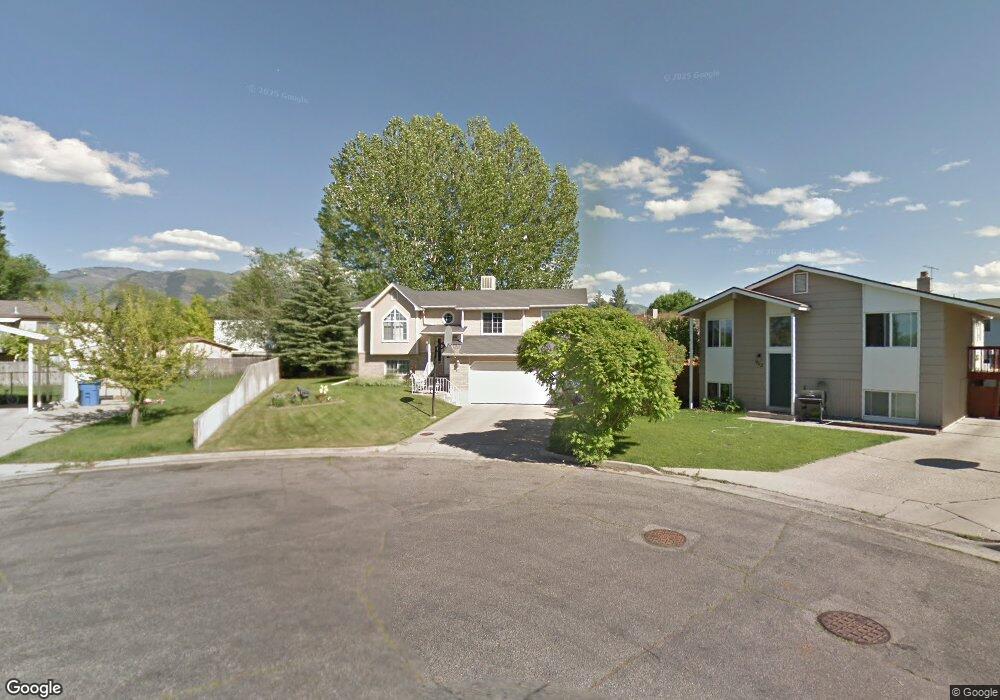
This home is located at 938 W 330 S, Logan, UT 84321 and is currently estimated at $380,229, approximately $200 per square foot. 938 W 330 S is a home located in Cache County with nearby schools including Woodruff School, Mount Logan Middle School, and Logan High School.
Ownership History
Date
Name
Owned For
Owner Type
Purchase Details
Closed on
Mar 21, 2022
Sold by
Lindley Patterson Gina Marie
Bought by
Gina Patterson Living Trust
Current Estimated Value
Purchase Details
Closed on
Jul 31, 2019
Sold by
Perkins Lindley Scott Bodrero and Perkins Lindley Arnold Reed
Bought by
Bodrero Lindley Scott and A Reed Lindley Inter Vivos Tru
Purchase Details
Closed on
Jul 5, 2019
Sold by
Lindley Scott Bodrero and A Reed Lindley Intervivos Trus
Bought by
Patterson Gina Marie Lindley
Create a Home Valuation Report for This Property
The Home Valuation Report is an in-depth analysis detailing your home's value as well as a comparison with similar homes in the area
Home Values in the Area
Average Home Value in this Area
Purchase History
| Date | Buyer | Sale Price | Title Company |
|---|---|---|---|
| Gina Patterson Living Trust | -- | Recorded Return | |
| Gina Patterson Living Trust | -- | None Listed On Document | |
| Bodrero Lindley Scott | -- | None Available | |
| Patterson Gina Marie Lindley | -- | None Available |
Source: Public Records
Tax History
| Year | Tax Paid | Tax Assessment Tax Assessment Total Assessment is a certain percentage of the fair market value that is determined by local assessors to be the total taxable value of land and additions on the property. | Land | Improvement |
|---|---|---|---|---|
| 2025 | $1,712 | $221,385 | $0 | $0 |
| 2024 | $1,757 | $220,100 | $0 | $0 |
| 2023 | $1,819 | $217,185 | $0 | $0 |
| 2022 | $1,619 | $180,530 | $0 | $0 |
| 2021 | $1,528 | $263,250 | $46,650 | $216,600 |
| 2020 | $1,465 | $227,150 | $46,650 | $180,500 |
| 2019 | $1,222 | $181,321 | $46,650 | $134,671 |
| 2018 | $1,187 | $160,778 | $46,650 | $114,128 |
| 2017 | $1,067 | $76,395 | $0 | $0 |
| 2016 | $1,106 | $76,395 | $0 | $0 |
| 2015 | $1,107 | $76,395 | $0 | $0 |
| 2014 | $920 | $70,185 | $0 | $0 |
| 2013 | -- | $70,185 | $0 | $0 |
Source: Public Records
Map
Nearby Homes
- 952 W 330 S
- 1400 S 940 W
- 1031 W 350 S
- 207 Sunstone Cir
- 1099 Three Pointe Ave
- 501 Southwest St
- 553 Center Ave
- 370 S 1200 W Unit 2
- 508 S 1215 W Unit 144
- 539 S 1215 W Unit 129
- 551 S 1215 W Unit 131
- 1214 W 575 S
- 1204 W 575 S
- 1210 W 575 S Unit 163
- 1210 W 575 S
- 562 S 1215 W Unit 135
- 1239 W 575 S
- 245 S 1280 W
- 226 S 600 W
- 1615 Silver Canoe Way
Your Personal Tour Guide
Ask me questions while you tour the home.