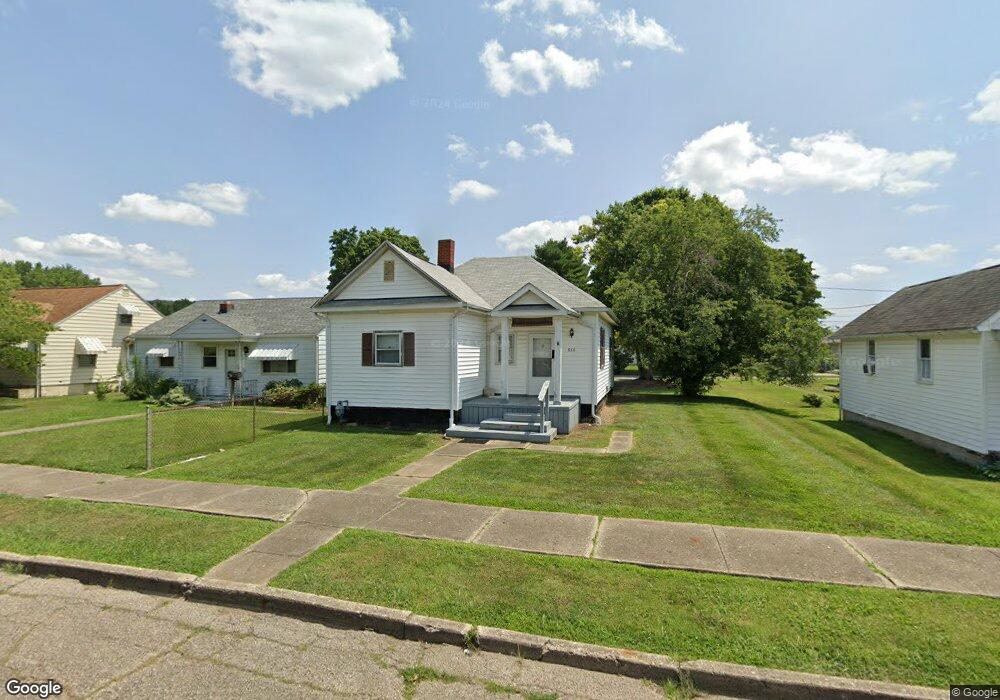
938 Washington Ave Lancaster, OH 43130
Estimated Value: $153,000 - $167,000
2
Beds
1
Bath
817
Sq Ft
$195/Sq Ft
Est. Value
About This Home
This home is located at 938 Washington Ave, Lancaster, OH 43130 and is currently estimated at $158,950, approximately $194 per square foot. 938 Washington Ave is a home located in Fairfield County with nearby schools including General Sherman Junior High School, Lancaster High School, and St Mary Elementary School.
Ownership History
Date
Name
Owned For
Owner Type
Purchase Details
Closed on
Aug 8, 2019
Sold by
Ballard Thomas L
Bought by
Johnson Investments Llc
Current Estimated Value
Purchase Details
Closed on
Feb 11, 2019
Sold by
U S Bank National Associationg
Bought by
Ballard Thomas L
Purchase Details
Closed on
Oct 11, 2018
Sold by
Ansel Daniel K
Bought by
U S Bank N A
Purchase Details
Closed on
Sep 22, 2005
Sold by
Estate Of Norma J Ansel
Bought by
Ansel Daniel K
Purchase Details
Closed on
May 17, 1999
Sold by
Lowe Chad A
Bought by
Ansel Daniel K and Ansel Norma J
Home Financials for this Owner
Home Financials are based on the most recent Mortgage that was taken out on this home.
Original Mortgage
$79,070
Interest Rate
7.04%
Mortgage Type
FHA
Purchase Details
Closed on
Jan 25, 1994
Sold by
Daigle Normand
Bought by
Lowe Chad A
Purchase Details
Closed on
Jul 8, 1991
Sold by
Coakley Christopher A
Bought by
Diagle Normand
Create a Home Valuation Report for This Property
The Home Valuation Report is an in-depth analysis detailing your home's value as well as a comparison with similar homes in the area
Home Values in the Area
Average Home Value in this Area
Purchase History
| Date | Buyer | Sale Price | Title Company |
|---|---|---|---|
| Johnson Investments Llc | $45,000 | Northwest Advantage Ttl Agcy | |
| Ballard Thomas L | $31,850 | Sojourners Title Agency | |
| U S Bank N A | $38,000 | Sojourners Title Company | |
| Ansel Daniel K | -- | -- | |
| Ansel Daniel K | $79,500 | -- | |
| Lowe Chad A | $53,500 | -- | |
| Diagle Normand | $24,000 | -- |
Source: Public Records
Mortgage History
| Date | Status | Borrower | Loan Amount |
|---|---|---|---|
| Previous Owner | Ansel Daniel K | $79,070 |
Source: Public Records
Tax History Compared to Growth
Tax History
| Year | Tax Paid | Tax Assessment Tax Assessment Total Assessment is a certain percentage of the fair market value that is determined by local assessors to be the total taxable value of land and additions on the property. | Land | Improvement |
|---|---|---|---|---|
| 2024 | $2,938 | $32,680 | $7,100 | $25,580 |
| 2023 | $1,265 | $32,680 | $7,100 | $25,580 |
| 2022 | $1,265 | $32,680 | $7,100 | $25,580 |
| 2021 | $1,054 | $25,340 | $7,100 | $18,240 |
| 2020 | $365 | $25,340 | $7,100 | $18,240 |
| 2019 | $967 | $25,340 | $7,100 | $18,240 |
| 2018 | $877 | $21,050 | $7,100 | $13,950 |
| 2017 | $875 | $20,370 | $7,100 | $13,270 |
| 2016 | $757 | $20,370 | $7,100 | $13,270 |
| 2015 | $768 | $20,460 | $7,100 | $13,360 |
| 2014 | $731 | $20,460 | $7,100 | $13,360 |
| 2013 | $731 | $20,460 | $7,100 | $13,360 |
Source: Public Records
Map
Nearby Homes
- 815 Beacon St
- 953 Garfield Ave
- 844 Washington Ave
- 1000 Goodwin Ave
- 1410 W Fair Ave
- 1318 Graf St
- 0 Marks Ave Unit 225036443
- 1125 Olds Ave
- 525 N Zane Ave
- 429 Harrison Ave
- 315 Park St
- 0 Wacker Dr Unit 225036189
- 1700 N Columbus St
- 404 Garfield Ave
- 517 Busby Ave
- 222 Park St
- 226 Whittier Dr S
- 539 N Ohio Ave
- 552 Summitview Dr
- 224 Harrison Ave
- 938 Washington Ave
- 950 Washington Ave
- 930 Washington Ave
- 956 Washington Ave
- 947 Harrison Ave
- 941 Washington Ave
- 941 Washington Ave
- 943 Washington Ave
- 937 Washington Ave
- 953 Washington Ave
- 943 Harrison Ave
- 937 Harrison Ave
- 933 Washington Ave
- 951 Harrison Ave
- 931 Harrison Ave
- 908 Beacon St
- 955 Harrison Ave
- 927 Harrison Ave
- 921 Washington Ave
- 819 Beacon St