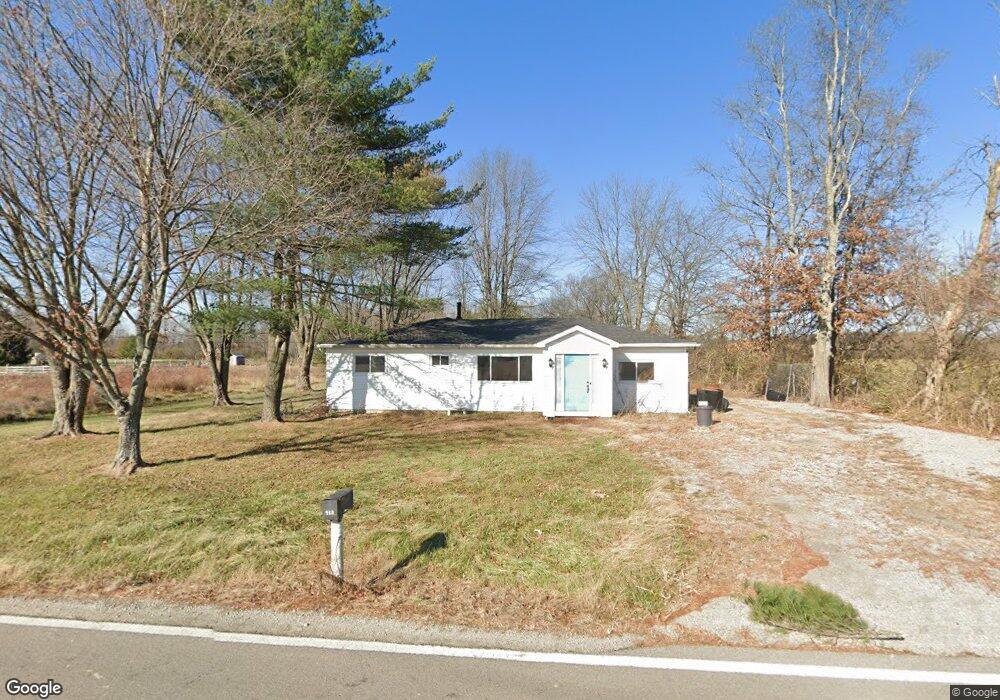
938 Woodville Rd Blanchester, OH 45107
Estimated Value: $201,364 - $405,000
3
Beds
2
Baths
1,536
Sq Ft
$173/Sq Ft
Est. Value
About This Home
This home is located at 938 Woodville Rd, Blanchester, OH 45107 and is currently estimated at $265,841, approximately $173 per square foot. 938 Woodville Rd is a home located in Clinton County with nearby schools including Cross Roads Elementary School, Putman Elementary School, and Blanchester Middle School.
Ownership History
Date
Name
Owned For
Owner Type
Purchase Details
Closed on
Aug 4, 2023
Sold by
Maerki Ernest F
Bought by
Maerki Ernest F and Maerki Terah N
Current Estimated Value
Purchase Details
Closed on
Jul 20, 2023
Sold by
Nationstar Mortgage Llc
Bought by
Maerki Ernest
Purchase Details
Closed on
Jun 26, 2023
Sold by
Fizer Ralph D
Bought by
Nationstar Mortgage Llc and Roark
Purchase Details
Closed on
Sep 15, 2010
Sold by
Roark Stephanie
Bought by
Roark James
Purchase Details
Closed on
Mar 21, 2007
Sold by
Bramble Savings Bank
Bought by
Roark James and Roark Stephanie
Purchase Details
Closed on
Dec 22, 2006
Sold by
Krummen John and Krummen Maria
Bought by
Bramble Savings Bank
Purchase Details
Closed on
Jun 10, 1998
Bought by
Krummen John and Krummen Maria
Purchase Details
Closed on
Apr 21, 1998
Sold by
Crawford Werner A
Bought by
Crawford Werner A
Create a Home Valuation Report for This Property
The Home Valuation Report is an in-depth analysis detailing your home's value as well as a comparison with similar homes in the area
Home Values in the Area
Average Home Value in this Area
Purchase History
| Date | Buyer | Sale Price | Title Company |
|---|---|---|---|
| Maerki Ernest F | -- | None Listed On Document | |
| Maerki Ernest | $67,000 | Servicelink | |
| Nationstar Mortgage Llc | $41,100 | None Listed On Document | |
| Roark James | -- | -- | |
| Roark James | $122,500 | -- | |
| Bramble Savings Bank | $91,000 | -- | |
| Krummen John | $37,000 | -- | |
| Crawford Werner A | -- | -- |
Source: Public Records
Tax History Compared to Growth
Tax History
| Year | Tax Paid | Tax Assessment Tax Assessment Total Assessment is a certain percentage of the fair market value that is determined by local assessors to be the total taxable value of land and additions on the property. | Land | Improvement |
|---|---|---|---|---|
| 2024 | $1,597 | $46,660 | $6,410 | $40,250 |
| 2023 | $1,597 | $24,650 | $6,410 | $18,240 |
| 2022 | $1,176 | $31,590 | $4,000 | $27,590 |
| 2021 | $1,213 | $31,590 | $4,000 | $27,590 |
| 2020 | $1,209 | $31,590 | $4,000 | $27,590 |
| 2019 | $990 | $25,710 | $4,000 | $21,710 |
| 2018 | $994 | $25,710 | $4,000 | $21,710 |
| 2017 | $971 | $25,710 | $4,000 | $21,710 |
| 2016 | $937 | $24,540 | $5,110 | $19,430 |
| 2015 | $937 | $24,540 | $5,110 | $19,430 |
| 2013 | $954 | $24,190 | $5,110 | $19,080 |
Source: Public Records
Map
Nearby Homes
- 2011 Fayetteville Rd
- 21602 Woodville Rd
- 507 Bourbon St
- 10834 State Route 28
- 315 Rayford St
- 753 W Main St
- 7484 Fairground Rd
- 7478 Fairground Rd
- 128 W Burroughs St
- 305 W Main St
- 0 Ohio 123 Unit 11 938995
- 0 Ohio 123 Unit 1848086
- 502 Railroad St
- 107 Central Ave
- 503 S Broadway St
- B Cherry St
- 301 W Main St
- 5458 Oak Grove Ave
- 213 N Broadway St
- 409 N Broadway St
- 67 Goodwin Rd
- 1008 Woodville Rd
- 1044 Woodville Rd
- 1080 Woodville Rd
- 112 Heritage Ridge Rd
- 126 Old State Route 133
- 1104 Woodville Rd
- 156 Old State Route 133
- 181 Heritage Ridge Rd
- Tract C Woodville Rd
- Tract B Woodville Rd
- 1168 Woodville Rd
- 30 Heritage Woods Dr Unit 30
- 30 Heritage Woods Dr
- 24 Heritage Woods Dr Unit 24
- 22 Heritage Woods Dr Unit 22
- 20 Heritage Woods Dr Unit 20
- 18 Heritage Woods Dr Unit 18
- 16 Heritage Woods Dr Unit 16
- 6 Heritage Woods Dr Unit 6