S
Landlord's Agent in 2014
SHERLEY ANICET
Redfin Corporation
Estimated Value: $333,000 - $355,000
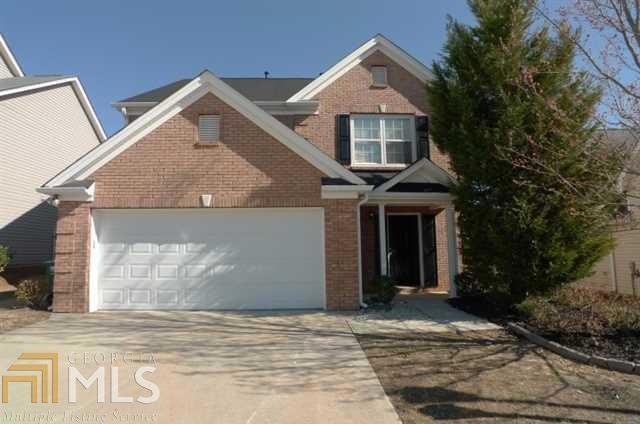
Gorgeous three bedroom two and a half bathroom home in Grayson! This home features spacious rooms, neutral paint and ceiling fans throughout, eat-in kitchen with included appliances, family room with fireplace, two-car garage, and a spacious yard. This home is a must see! Please call for more information today.
Last Agent to Rent the Property
SHERLEY ANICET
Redfin Corporation License #344953 Listed on: 04/10/2014

| Date | Buyer | Sale Price | Title Company |
|---|---|---|---|
| Swh 2017 1 Borrower Lp | -- | -- | |
| Sway 2014 1 Borrower Llc | -- | -- | |
| Tarbert Llc | -- | -- | |
| Srp Sub Llc | $100,800 | -- | |
| Chowdhury Omar F | $145,600 | -- |
| Date | Status | Borrower | Loan Amount |
|---|---|---|---|
| Previous Owner | Chowdhury Omar F | $144,350 |
| Date | Event | Price | List to Sale | Price per Sq Ft |
|---|---|---|---|---|
| 04/10/2014 04/10/14 | Rented | $1,175 | 0.0% | -- |
| 04/10/2014 04/10/14 | For Rent | $1,175 | -- | -- |
| Year | Tax Paid | Tax Assessment Tax Assessment Total Assessment is a certain percentage of the fair market value that is determined by local assessors to be the total taxable value of land and additions on the property. | Land | Improvement |
|---|---|---|---|---|
| 2025 | $4,506 | $142,600 | $30,000 | $112,600 |
| 2024 | $3,483 | $108,840 | $22,000 | $86,840 |
| 2023 | $3,483 | $108,840 | $22,000 | $86,840 |
| 2022 | $3,494 | $108,840 | $22,000 | $86,840 |
| 2021 | $2,278 | $69,440 | $15,200 | $54,240 |
| 2020 | $2,657 | $69,440 | $15,200 | $54,240 |
| 2019 | $2,135 | $69,440 | $15,200 | $54,240 |
| 2018 | $2,143 | $55,720 | $12,000 | $43,720 |
| 2016 | $2,141 | $55,720 | $12,000 | $43,720 |
| 2015 | $1,564 | $40,320 | $9,600 | $30,720 |
| 2014 | -- | $40,320 | $9,600 | $30,720 |
S
Landlord's Agent in 2014
SHERLEY ANICET
Redfin Corporation
Tenant's Agent in 2014
Glenda Broker
Non-Mls Company
(800) 289-1214
Source: Georgia MLS
MLS Number: 7250794
APN: 5-101-294
Disclaimer: Certain information contained herein is derived from information provided by parties other than Homes.com. All information provided is deemed reliable, but is not guaranteed to be accurate and should be independently verified.
![]() The data relating to real estate for sale on this web site comes in part from the Broker Reciprocity Program of Georgia MLS. Real estate listings held by brokerage firms other than Redfin are marked with the Broker Reciprocity logo and detailed information about them includes the name of the listing brokers. Information deemed reliable but not guaranteed. Copyright 2025 Georgia MLS. All rights reserved.
The data relating to real estate for sale on this web site comes in part from the Broker Reciprocity Program of Georgia MLS. Real estate listings held by brokerage firms other than Redfin are marked with the Broker Reciprocity logo and detailed information about them includes the name of the listing brokers. Information deemed reliable but not guaranteed. Copyright 2025 Georgia MLS. All rights reserved.