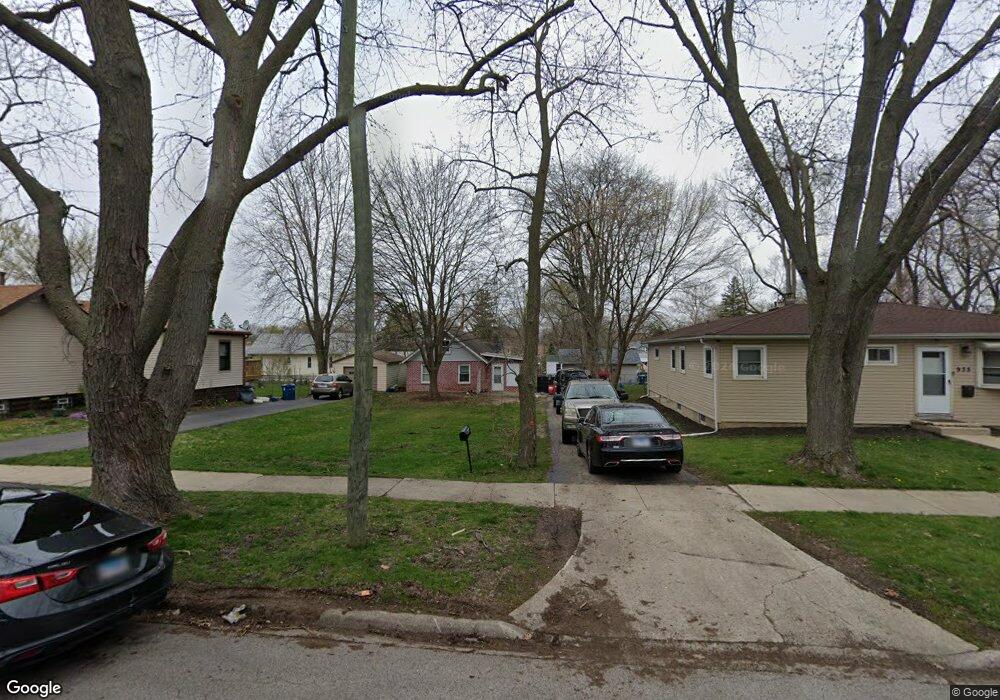
939 Charles St Aurora, IL 60506
Blackhawk NeighborhoodEstimated Value: $215,000 - $254,000
2
Beds
1
Bath
1,055
Sq Ft
$223/Sq Ft
Est. Value
About This Home
This home is located at 939 Charles St, Aurora, IL 60506 and is currently estimated at $235,041, approximately $222 per square foot. 939 Charles St is a home located in Kane County with nearby schools including Greenman Elementary School, Jefferson Middle School, and West Aurora High School.
Ownership History
Date
Name
Owned For
Owner Type
Purchase Details
Closed on
May 25, 2022
Sold by
Albarran Flores Evencio
Bought by
Flores Lorena Albarran
Current Estimated Value
Purchase Details
Closed on
Jun 24, 2011
Sold by
Solis Lorena
Bought by
Flores Evencio Albarran
Purchase Details
Closed on
May 6, 2010
Sold by
Us Bank National Association
Bought by
Solis Lorena
Purchase Details
Closed on
Oct 5, 2009
Sold by
Ward Shelia and Ward Sheila
Bought by
Us Bank National Association
Purchase Details
Closed on
Nov 17, 2004
Sold by
Mcelhone Wayne M and Mcelhone Marie E
Bought by
Ward Sheila
Home Financials for this Owner
Home Financials are based on the most recent Mortgage that was taken out on this home.
Original Mortgage
$108,202
Interest Rate
5.82%
Mortgage Type
FHA
Create a Home Valuation Report for This Property
The Home Valuation Report is an in-depth analysis detailing your home's value as well as a comparison with similar homes in the area
Home Values in the Area
Average Home Value in this Area
Purchase History
| Date | Buyer | Sale Price | Title Company |
|---|---|---|---|
| Flores Lorena Albarran | -- | New Title Company Name | |
| Flores Evencio Albarran | -- | First American Title Ins Co | |
| Solis Lorena | $35,000 | Ticor Title Insurance Co | |
| Us Bank National Association | -- | None Available | |
| Ward Sheila | $110,000 | First American Title Ins Co |
Source: Public Records
Mortgage History
| Date | Status | Borrower | Loan Amount |
|---|---|---|---|
| Previous Owner | Ward Sheila | $108,202 |
Source: Public Records
Tax History Compared to Growth
Tax History
| Year | Tax Paid | Tax Assessment Tax Assessment Total Assessment is a certain percentage of the fair market value that is determined by local assessors to be the total taxable value of land and additions on the property. | Land | Improvement |
|---|---|---|---|---|
| 2024 | $4,978 | $62,870 | $9,158 | $53,712 |
| 2023 | $4,812 | $56,174 | $8,183 | $47,991 |
| 2022 | $4,420 | $49,931 | $7,466 | $42,465 |
| 2021 | $4,247 | $46,486 | $6,951 | $39,535 |
| 2020 | $4,042 | $43,178 | $6,456 | $36,722 |
| 2019 | $3,912 | $40,006 | $5,982 | $34,024 |
| 2018 | $3,295 | $33,006 | $5,533 | $27,473 |
| 2017 | $2,999 | $29,140 | $5,098 | $24,042 |
| 2016 | $2,671 | $25,141 | $4,370 | $20,771 |
| 2015 | -- | $23,940 | $3,758 | $20,182 |
| 2014 | -- | $22,146 | $3,454 | $18,692 |
| 2013 | -- | $26,687 | $3,301 | $23,386 |
Source: Public Records
Map
Nearby Homes
- 943 Charles St
- 900 Charles St
- 930 W New York St Unit 932
- 850 W Galena Blvd
- 809 W Park Ave
- 931 W Downer Place
- 616 Morton Ave
- 710 W Downer Place
- 175 S Harrison Ave
- 1104 New Haven Ave
- 932 W New York St
- 541 Charles St
- 237 Ingleside Ave
- 781 N Elmwood Dr
- 149 S Gladstone Ave
- 518 W Park Ave
- 795 N Elmwood Dr
- 602 N May St
- 164 S Calumet Ave
- 231 W Downer Place
- 935 Charles St
- 304 Howard Ave
- 313 N Elmwood Dr
- 312 Howard Ave
- 317 N Elmwood Dr
- 316 Howard Ave
- 401 N Elmwood Dr
- 402 Howard Ave
- 938 Charles St
- 932 Charles St
- 940 Charles St
- 928 Charles St
- 217 N Elmwood Dr
- 405 N Elmwood Dr
- 919 Charles St
- 408 Howard Ave
- 926 Charles St
- 308 N Elmwood Dr
- 302 N Elmwood Dr
- 407 N Elmwood Dr