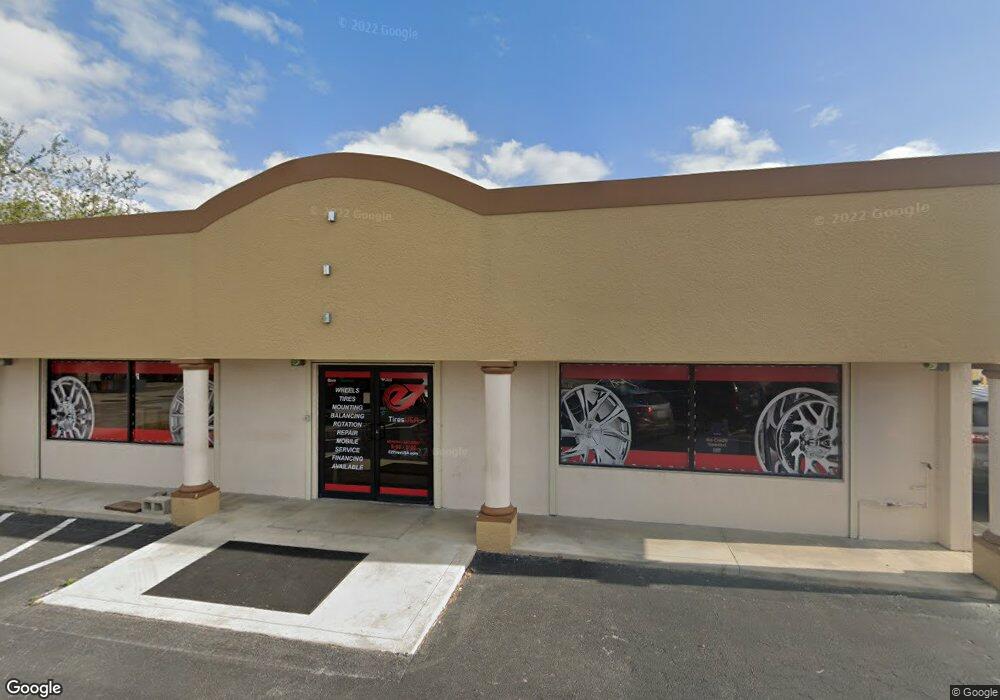
939 Country Club Blvd Unit A-B Cape Coral, FL 33990
Hancock Neighborhood
--
Bed
2
Baths
2,040
Sq Ft
0.6
Acres
About This Home
This home is located at 939 Country Club Blvd Unit A-B, Cape Coral, FL 33990. 939 Country Club Blvd Unit A-B is a home located in Lee County with nearby schools including Caloosa Elementary School, Tropic Isles Elementary School, and Hancock Creek Elementary School.
Ownership History
Date
Name
Owned For
Owner Type
Purchase Details
Closed on
Nov 4, 2013
Sold by
Cj Investment Services Ltd
Bought by
Thk Properties Inc
Home Financials for this Owner
Home Financials are based on the most recent Mortgage that was taken out on this home.
Original Mortgage
$287,000
Outstanding Balance
$214,876
Interest Rate
4.33%
Mortgage Type
Seller Take Back
Purchase Details
Closed on
Feb 21, 2013
Sold by
Chaviano Antonio and Chaviano Teresa I
Bought by
Quality Control Inc
Purchase Details
Closed on
Jul 15, 2010
Sold by
Free Jeffrey A and Free Alison D
Bought by
Chaviano Antonio and Chaviano Teresa
Purchase Details
Closed on
Jun 24, 2010
Sold by
Free Jeffrey A and Free Alison D
Bought by
Free Jeffrey A and Free Alison D
Purchase Details
Closed on
May 22, 2007
Sold by
Free Jeffrey A and Free Alison D
Bought by
Free Jeffrey A and Free Alison D
Purchase Details
Closed on
Nov 17, 2005
Sold by
Chaviano Antonio
Bought by
Free Jeffrey A and Free Alison D
Create a Home Valuation Report for This Property
The Home Valuation Report is an in-depth analysis detailing your home's value as well as a comparison with similar homes in the area
Home Values in the Area
Average Home Value in this Area
Purchase History
| Date | Buyer | Sale Price | Title Company |
|---|---|---|---|
| Thk Properties Inc | $387,000 | Attorney | |
| Quality Control Inc | -- | Attorney | |
| Chaviano Antonio | $591,900 | Cape Coral Title Insurance A | |
| Free Jeffrey A | -- | None Available | |
| Free Jeffrey A | -- | Attorney | |
| Free Jeffrey A | $368,500 | Cape Coral Title Insurance A |
Source: Public Records
Mortgage History
| Date | Status | Borrower | Loan Amount |
|---|---|---|---|
| Open | Thk Properties Inc | $287,000 |
Source: Public Records
Tax History Compared to Growth
Tax History
| Year | Tax Paid | Tax Assessment Tax Assessment Total Assessment is a certain percentage of the fair market value that is determined by local assessors to be the total taxable value of land and additions on the property. | Land | Improvement |
|---|---|---|---|---|
| 2025 | $6,276 | $263,992 | -- | -- |
| 2024 | $5,703 | $239,993 | -- | -- |
| 2023 | $5,703 | $218,175 | $0 | $0 |
| 2022 | $4,698 | $198,341 | $0 | $0 |
| 2021 | $4,668 | $356,631 | $96,256 | $260,375 |
| 2020 | $4,255 | $297,830 | $38,968 | $258,862 |
| 2019 | $4,041 | $293,243 | $38,039 | $255,204 |
| 2018 | $3,268 | $185,220 | $19,688 | $165,532 |
| 2017 | $2,950 | $155,985 | $17,500 | $138,485 |
| 2016 | $2,811 | $154,788 | $28,210 | $126,578 |
| 2015 | $2,326 | $101,780 | $23,835 | $77,945 |
| 2014 | -- | $101,177 | $23,835 | $77,342 |
| 2013 | -- | $95,490 | $18,148 | $77,342 |
Source: Public Records
Map
Nearby Homes
- 1039 SE 10th St
- 1031 SE 8th Terrace Unit 2H
- 1104 SE 8th St Unit 5
- 1109 Country Club Blvd
- 1001 SE 12th Ln
- 1020 SE 13th Ave
- 1234 SE 13th Ave
- 916 SE 8th Terrace
- 719 SE 12th Ave Unit 106
- 1939 SE 10th Ave
- 222 SE 10th Ave
- 1223 SE 8th St Unit 48
- 711 SE 12th Ave Unit 136
- 711 SE 12th Ave Unit 134
- 711 SE 12th Ave Unit 135
- 711 SE 11th Ave
- 1309 SE 10th Terrace
- 717 SE 10th Ave
- 1138 SE 9th Ct
- 706,712,718 SE 7th St
- 945 Country Club Blvd
- 947 Country Club Blvd
- 1024 SE 12th Ave
- 932 Country Club Blvd
- 944 Country Club Blvd Unit 107
- 944 Country Club Blvd Unit 109-A
- 923 Country Club Blvd
- 1118 SE 12th Ave Unit C
- 1105 SE 12th Ave Unit D
- 1105 SE 12th Ave Unit E
- 1105 SE 12th Ave Unit B
- 1105 SE 12th Ave Unit C
- 1105 SE 12th Ave
- 1107 SE 12th Ave
- 954 Country Club Blvd Unit A-B
- 943 SE 11th Ave
- 919 Country Club Blvd
- 1023 SE 12th Ave
- 949 SE 11th Ave
- 1112 SE 9th Ln Unit A