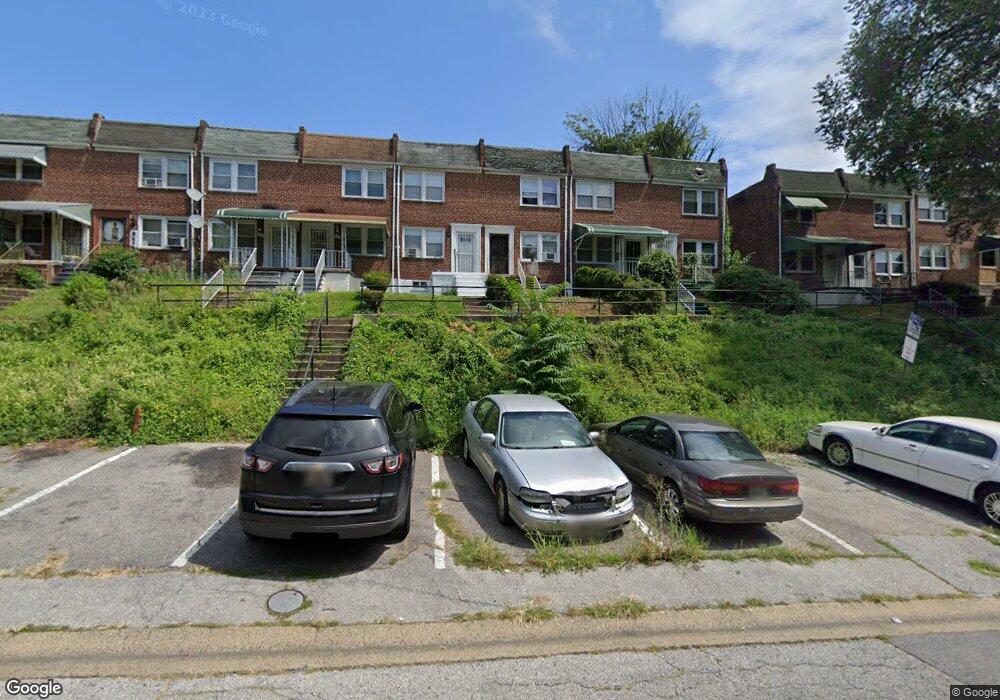
939 Ellicott Dr Baltimore, MD 21216
Franklintown Road NeighborhoodEstimated Value: $114,000 - $115,769
--
Bed
1
Bath
840
Sq Ft
$137/Sq Ft
Est. Value
About This Home
This home is located at 939 Ellicott Dr, Baltimore, MD 21216 and is currently estimated at $114,885, approximately $136 per square foot. 939 Ellicott Dr is a home located in Baltimore City with nearby schools including Booker T. Washington Middle School, Edmondson Westside High School, and Frederick Douglass High School.
Ownership History
Date
Name
Owned For
Owner Type
Purchase Details
Closed on
Sep 2, 2025
Sold by
Briscoe Maurice and Cohen Merrill
Bought by
North Ave Mbpr Holdings Llc
Current Estimated Value
Purchase Details
Closed on
Mar 14, 2006
Sold by
We Got You Properties Llc
Bought by
Briscoe Maurice
Purchase Details
Closed on
Dec 13, 2005
Sold by
Dominion Rentals Llc
Bought by
We Got You Properties Llc
Purchase Details
Closed on
Oct 17, 2005
Sold by
Dominion Rentals Llc
Bought by
We Got You Properties Llc
Purchase Details
Closed on
Jan 19, 2005
Sold by
Jp Morgan Chase Bank As
Bought by
Dominion Rentals Llc
Purchase Details
Closed on
Dec 1, 2004
Sold by
Newton Anthony
Bought by
Jp Morgan Chase Bank As
Purchase Details
Closed on
Oct 6, 2004
Sold by
Newton Anthony
Bought by
Jp Morgan Chase Bank As
Purchase Details
Closed on
Feb 19, 2004
Sold by
Ruffin James
Bought by
Newton Anthony
Create a Home Valuation Report for This Property
The Home Valuation Report is an in-depth analysis detailing your home's value as well as a comparison with similar homes in the area
Home Values in the Area
Average Home Value in this Area
Purchase History
| Date | Buyer | Sale Price | Title Company |
|---|---|---|---|
| North Ave Mbpr Holdings Llc | $35,000 | Chicago Title | |
| Briscoe Maurice | $50,640 | -- | |
| We Got You Properties Llc | $33,480 | -- | |
| We Got You Properties Llc | $33,480 | -- | |
| Dominion Rentals Llc | $28,500 | -- | |
| Jp Morgan Chase Bank As | $36,290 | -- | |
| Jp Morgan Chase Bank As | $36,290 | -- | |
| Newton Anthony | $45,000 | -- |
Source: Public Records
Tax History Compared to Growth
Tax History
| Year | Tax Paid | Tax Assessment Tax Assessment Total Assessment is a certain percentage of the fair market value that is determined by local assessors to be the total taxable value of land and additions on the property. | Land | Improvement |
|---|---|---|---|---|
| 2025 | $1,819 | $86,367 | -- | -- |
| 2024 | $1,819 | $77,433 | $0 | $0 |
| 2023 | $1,609 | $68,500 | $13,000 | $55,500 |
| 2022 | $1,542 | $65,333 | $0 | $0 |
| 2021 | $1,467 | $62,167 | $0 | $0 |
| 2020 | $1,392 | $59,000 | $13,000 | $46,000 |
| 2019 | $1,369 | $58,267 | $0 | $0 |
| 2018 | $1,358 | $57,533 | $0 | $0 |
| 2017 | $1,340 | $56,800 | $0 | $0 |
| 2016 | $1,597 | $56,800 | $0 | $0 |
| 2015 | $1,597 | $56,800 | $0 | $0 |
| 2014 | $1,597 | $57,900 | $0 | $0 |
Source: Public Records
Map
Nearby Homes
- 945 Ellicott Drwy
- 930 N Rosedale St
- 929 N Rosedale St
- 904 N Rosedale St
- 907 N Rosedale St
- 2916 W Lafayette Ave
- 3014 Rayner Ave
- 2915 W Mosher St
- 918 Poplar Grove St
- 3028 Harlem Ave
- 2902 W Mosher St
- 3039 Harlem Ave
- 1136 N Longwood St
- 707 N Longwood St
- 2871 W Lanvale St
- 1204 N Longwood St
- 1013 Poplar Grove St
- 2863 W Lanvale St
- 2946 Arunah Ave
- 2859 W Lanvale St
- 937 Ellicott Dr
- 935 Ellicott Dr
- 941 Ellicott Dr
- 941 Ellicott Driveway
- 933 Ellicott Driveway
- 933 Ellicott Dr
- 943 Ellicott Driveway
- 943 Ellicott Dr
- 931 Ellicott Dr
- 945 Ellicott Dr
- 929 Ellicott Dr
- 947 Ellicott Dr
- 927 Ellicott Dr
- 949 Ellicott Dr
- 925 Ellicott Dr
- 951 Ellicott Dr
- 926 N Rosedale St
- 924 N Rosedale St
- 928 N Rosedale St
- 922 N Rosedale St