Estimated Value: $106,263 - $138,000
--
Bed
--
Bath
1,621
Sq Ft
$76/Sq Ft
Est. Value
About This Home
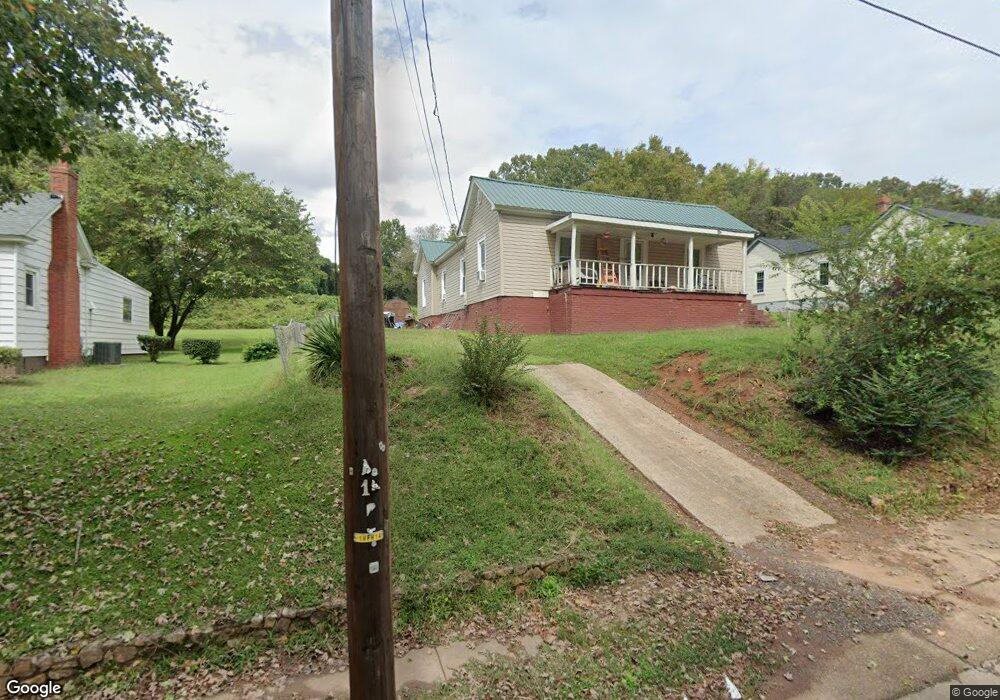
This home is located at 939 Harris St, Eden, NC 27288 and is currently estimated at $122,566, approximately $75 per square foot. 939 Harris St is a home located in Rockingham County with nearby schools including Leaksville-Spray Elementary School, J.E. Holmes Middle School, and John M. Morehead High School.
Ownership History
Date
Name
Owned For
Owner Type
Purchase Details
Closed on
May 4, 2020
Sold by
Vanderwerff Donald P
Bought by
Hayes Joshua and Hayes Shawna Michelle
Current Estimated Value
Home Financials for this Owner
Home Financials are based on the most recent Mortgage that was taken out on this home.
Original Mortgage
$19,000
Outstanding Balance
$16,837
Interest Rate
3.3%
Mortgage Type
Unknown
Estimated Equity
$105,729
Purchase Details
Closed on
Dec 2, 2019
Sold by
Johnson Joyce L and Johnson Michael A
Bought by
Vanderwerff Donald P
Purchase Details
Closed on
Jul 6, 2018
Sold by
Land Audie J and Land Cathy J
Bought by
Johnson Joyce L and Johnson Michael A
Home Financials for this Owner
Home Financials are based on the most recent Mortgage that was taken out on this home.
Original Mortgage
$15,500
Interest Rate
4.6%
Mortgage Type
Unknown
Create a Home Valuation Report for This Property
The Home Valuation Report is an in-depth analysis detailing your home's value as well as a comparison with similar homes in the area
Home Values in the Area
Average Home Value in this Area
Purchase History
| Date | Buyer | Sale Price | Title Company |
|---|---|---|---|
| Hayes Joshua | $19,000 | None Available | |
| Vanderwerff Donald P | $1,000 | None Available | |
| Johnson Joyce L | $43,000 | None Available |
Source: Public Records
Mortgage History
| Date | Status | Borrower | Loan Amount |
|---|---|---|---|
| Open | Hayes Joshua | $19,000 | |
| Previous Owner | Johnson Joyce L | $15,500 |
Source: Public Records
Tax History Compared to Growth
Tax History
| Year | Tax Paid | Tax Assessment Tax Assessment Total Assessment is a certain percentage of the fair market value that is determined by local assessors to be the total taxable value of land and additions on the property. | Land | Improvement |
|---|---|---|---|---|
| 2025 | $948 | $86,176 | $4,840 | $81,336 |
| 2024 | $948 | $86,176 | $4,840 | $81,336 |
| 2023 | $948 | $45,484 | $4,400 | $41,084 |
| 2022 | $593 | $45,484 | $4,400 | $41,084 |
| 2021 | $586 | $44,924 | $4,400 | $40,524 |
| 2020 | $586 | $44,924 | $4,400 | $40,524 |
| 2019 | $586 | $44,924 | $4,400 | $40,524 |
| 2018 | $430 | $32,927 | $6,388 | $26,539 |
| 2017 | $430 | $32,927 | $6,388 | $26,539 |
| 2015 | $434 | $32,927 | $6,388 | $26,539 |
| 2014 | -- | $32,927 | $6,388 | $26,539 |
Source: Public Records
Map
Nearby Homes
- 925 Harris St
- 910 Branch St
- 615 S Hamilton St
- 989 Harris St
- 994 Burton St
- 543 Patrick St
- 535 Patrick St
- 1028 Galloway St
- 627 Monroe St
- 645 Patterson St
- 1015 West Ave
- 521 Patrick St
- 115 Mountain Laurel Trail
- 561 N Bridge St
- 608 Cedar St
- 606 Cedar St
- 816 Elm St
- 508 Prospect St
- 526 N Bridge St
- 1101 Lawson St