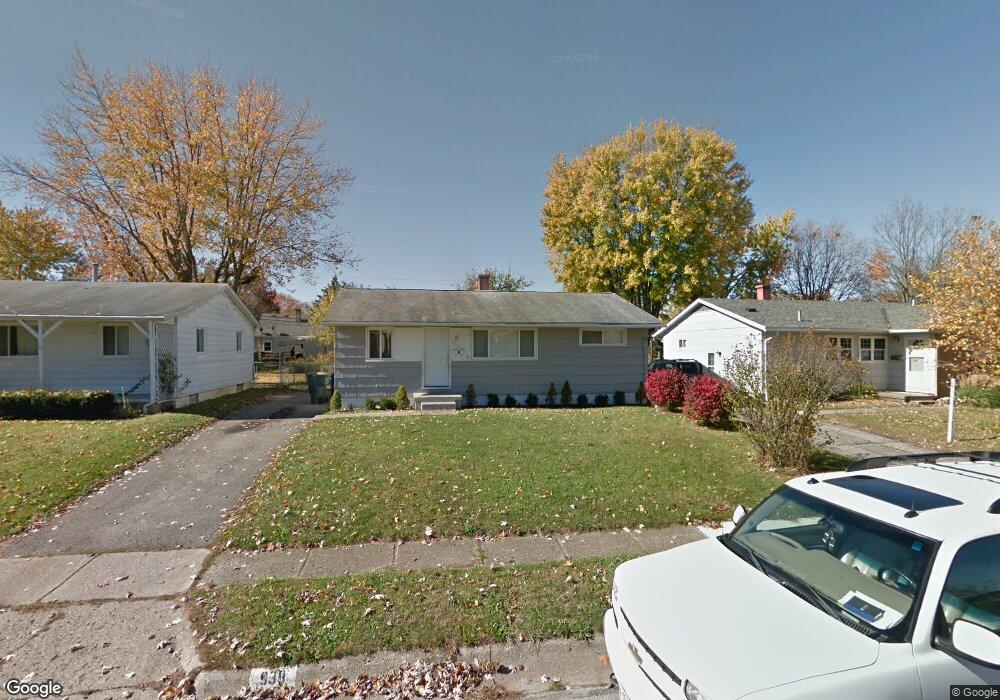
939 Hodges Dr Columbus, OH 43204
Brookshire NeighborhoodEstimated Value: $211,000 - $284,000
5
Beds
2
Baths
1,800
Sq Ft
$135/Sq Ft
Est. Value
About This Home
This home is located at 939 Hodges Dr, Columbus, OH 43204 and is currently estimated at $243,065, approximately $135 per square foot. 939 Hodges Dr is a home located in Franklin County with nearby schools including Lindbergh Elementary School, Hilltonia Middle School, and Briggs High School.
Ownership History
Date
Name
Owned For
Owner Type
Purchase Details
Closed on
Jun 10, 2020
Sold by
939 Hodges Llc
Bought by
Acox Angela R
Current Estimated Value
Home Financials for this Owner
Home Financials are based on the most recent Mortgage that was taken out on this home.
Original Mortgage
$164,900
Interest Rate
3.2%
Mortgage Type
New Conventional
Purchase Details
Closed on
Apr 20, 2012
Sold by
Heilman Thomas P
Bought by
939 Hodges Llc
Home Financials for this Owner
Home Financials are based on the most recent Mortgage that was taken out on this home.
Original Mortgage
$66,580
Interest Rate
3.9%
Mortgage Type
New Conventional
Purchase Details
Closed on
Feb 29, 2008
Sold by
Heilman Thomas P and Heilman Julie T
Bought by
939 Hodges Llc
Purchase Details
Closed on
Oct 7, 1991
Bought by
Heilman Ii Thomas P
Create a Home Valuation Report for This Property
The Home Valuation Report is an in-depth analysis detailing your home's value as well as a comparison with similar homes in the area
Home Values in the Area
Average Home Value in this Area
Purchase History
| Date | Buyer | Sale Price | Title Company |
|---|---|---|---|
| Acox Angela R | $170,000 | Landsel Title Agency Inc | |
| 939 Hodges Llc | -- | None Available | |
| Heilman Thomas P | -- | None Available | |
| 939 Hodges Llc | -- | Hummel Titl | |
| Heilman Ii Thomas P | $100,000 | -- |
Source: Public Records
Mortgage History
| Date | Status | Borrower | Loan Amount |
|---|---|---|---|
| Previous Owner | Acox Angela R | $164,900 | |
| Previous Owner | Heilman Thomas P | $66,580 |
Source: Public Records
Tax History Compared to Growth
Tax History
| Year | Tax Paid | Tax Assessment Tax Assessment Total Assessment is a certain percentage of the fair market value that is determined by local assessors to be the total taxable value of land and additions on the property. | Land | Improvement |
|---|---|---|---|---|
| 2024 | $2,345 | $52,260 | $13,270 | $38,990 |
| 2023 | $2,315 | $52,255 | $13,265 | $38,990 |
| 2022 | $1,440 | $27,760 | $6,370 | $21,390 |
| 2021 | $1,442 | $27,760 | $6,370 | $21,390 |
| 2020 | $1,514 | $27,760 | $6,370 | $21,390 |
| 2019 | $1,433 | $23,040 | $5,290 | $17,750 |
| 2018 | $1,325 | $23,040 | $5,290 | $17,750 |
| 2017 | $1,432 | $23,040 | $5,290 | $17,750 |
| 2016 | $1,306 | $19,220 | $4,760 | $14,460 |
| 2015 | $1,219 | $19,220 | $4,760 | $14,460 |
| 2014 | $1,192 | $19,220 | $4,760 | $14,460 |
| 2013 | $691 | $22,610 | $5,600 | $17,010 |
Source: Public Records
Map
Nearby Homes
- 975 Hodges Dr
- 2588 Regina Ave
- 2585 Eakin Rd
- 2579 Eakin Rd
- 2681 Vanderberg Ave
- 2610 Spaatz Ave
- 2687 Vanderberg Ave
- 2538 Vanderberg Ave
- 2530 Vanderberg Ave
- 2743 Bernadette Rd
- 811 S Richardson Ave
- 2743 Saint Joseph Ave
- 1060 Saint Agnes Ave
- 2783-2785 Vanderberg Ave
- 805 S Warren Ave
- 790 Racine Ave
- 734 S Richardson Ave
- 730 S Burgess Ave
- 727 S Richardson Ave
- 2547 Rosedale Ave
- 931 Hodges Dr
- 945 Hodges Dr
- 925 Hodges Dr
- 2614 Regina Ave
- 928 S Richardson Ave
- 922 S Richardson Ave
- 940 Hodges Dr
- 916 S Richardson Ave
- 942 S Richardson Ave
- 917 Hodges Dr
- 952 Hodges Dr
- 2579 Kreber Ave
- 909 Hodges Dr
- 2615 Regina Ave
- 920 Hodges Dr
- 904 S Richardson Ave
- 956 S Richardson Ave
- 2573 Kreber Ave
- 2576 Kreber Ave