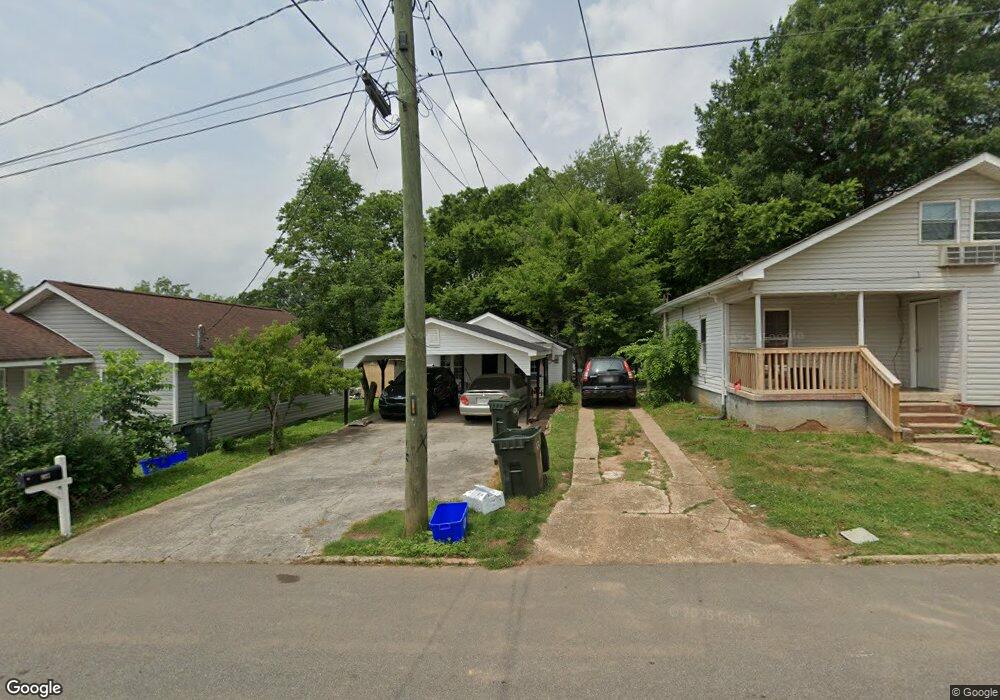
939 N Selvidge St Dalton, GA 30720
Estimated Value: $141,000 - $222,000
--
Bed
1
Bath
1,008
Sq Ft
$169/Sq Ft
Est. Value
About This Home
This home is located at 939 N Selvidge St, Dalton, GA 30720 and is currently estimated at $170,848, approximately $169 per square foot. 939 N Selvidge St is a home located in Whitfield County with nearby schools including City Park Elementary School, Dalton Middle School, and Dalton High School.
Ownership History
Date
Name
Owned For
Owner Type
Purchase Details
Closed on
Mar 18, 2024
Sold by
Star Home Solutions Lllp
Bought by
Shull Melinda Sue
Current Estimated Value
Home Financials for this Owner
Home Financials are based on the most recent Mortgage that was taken out on this home.
Original Mortgage
$7,450
Interest Rate
6.63%
Mortgage Type
New Conventional
Purchase Details
Closed on
Mar 31, 2006
Sold by
Vision View Properties Llc
Bought by
Vision Construction & Developm
Purchase Details
Closed on
Oct 6, 2005
Sold by
Vision View Properties Llc
Bought by
Pacheco Roberto L
Purchase Details
Closed on
Aug 7, 2005
Sold by
Vision View Properties Llc
Bought by
Uribe Raquel
Purchase Details
Closed on
May 31, 2000
Sold by
Burnette Ronald E and Burnette Joyce
Bought by
Vision View Properties Llc
Purchase Details
Closed on
Jul 1, 1998
Bought by
Burnette Ronald E and Burnette Joyce
Create a Home Valuation Report for This Property
The Home Valuation Report is an in-depth analysis detailing your home's value as well as a comparison with similar homes in the area
Home Values in the Area
Average Home Value in this Area
Purchase History
| Date | Buyer | Sale Price | Title Company |
|---|---|---|---|
| Shull Melinda Sue | $149,000 | None Listed On Document | |
| Vision Construction & Developm | -- | -- | |
| Pacheco Roberto L | $60,500 | -- | |
| Uribe Raquel | $64,500 | -- | |
| Vision View Properties Llc | $33,000 | -- | |
| Burnette Ronald E | $33,000 | -- |
Source: Public Records
Mortgage History
| Date | Status | Borrower | Loan Amount |
|---|---|---|---|
| Closed | Shull Melinda Sue | $7,450 | |
| Open | Shull Melinda Sue | $146,301 |
Source: Public Records
Tax History Compared to Growth
Tax History
| Year | Tax Paid | Tax Assessment Tax Assessment Total Assessment is a certain percentage of the fair market value that is determined by local assessors to be the total taxable value of land and additions on the property. | Land | Improvement |
|---|---|---|---|---|
| 2024 | $994 | $49,926 | $8,000 | $41,926 |
| 2023 | $994 | $26,877 | $2,100 | $24,777 |
| 2022 | $672 | $19,501 | $2,100 | $17,401 |
| 2021 | $673 | $19,501 | $2,100 | $17,401 |
| 2020 | $699 | $19,501 | $2,100 | $17,401 |
| 2019 | $720 | $19,501 | $2,100 | $17,401 |
| 2018 | $731 | $19,501 | $2,100 | $17,401 |
| 2017 | $704 | $19,501 | $2,100 | $17,401 |
| 2016 | $651 | $17,926 | $2,100 | $15,826 |
| 2014 | $592 | $17,926 | $2,100 | $15,826 |
| 2013 | -- | $17,926 | $2,100 | $15,826 |
Source: Public Records
Map
Nearby Homes
- 304 W Park St
- 1129 N Hamilton St
- 1119 Acme St
- 00 Glenwood Ave
- 318 W Tyler St
- 416 Sassafras St
- 601 Stillwood Dr
- 540 Stillwood Dr
- 928 Avenue C
- 916 Avenue E
- 940 Avenue E
- 727 W Tyler St
- 404 Paige St
- 1380 Lida St
- 717 Morningside Dr
- 907 Sierra Place Unit 57
- 303 Crystal Place Unit 16
- 303 Crystal Place
- 606 Virginia Ave
- 939 N Selvidge St
- 937 N Selvidge St
- 931 N Selvidge St
- 933 N Selvidge St
- 941 N Selvidge St
- 929 N Selvidge St
- 930 Rachel St
- 928 Rachel St
- LOT 357 Park St
- 932 Rachel St
- 925 N Selvidge St
- 926 Rachel St
- 1001 Dude St
- 924 Rachel St
- 923 N Selvidge St
- 110 W Park St
- 933 Rachel St
- 200 W Park St
- 922 Rachel St
- 105 W Park St