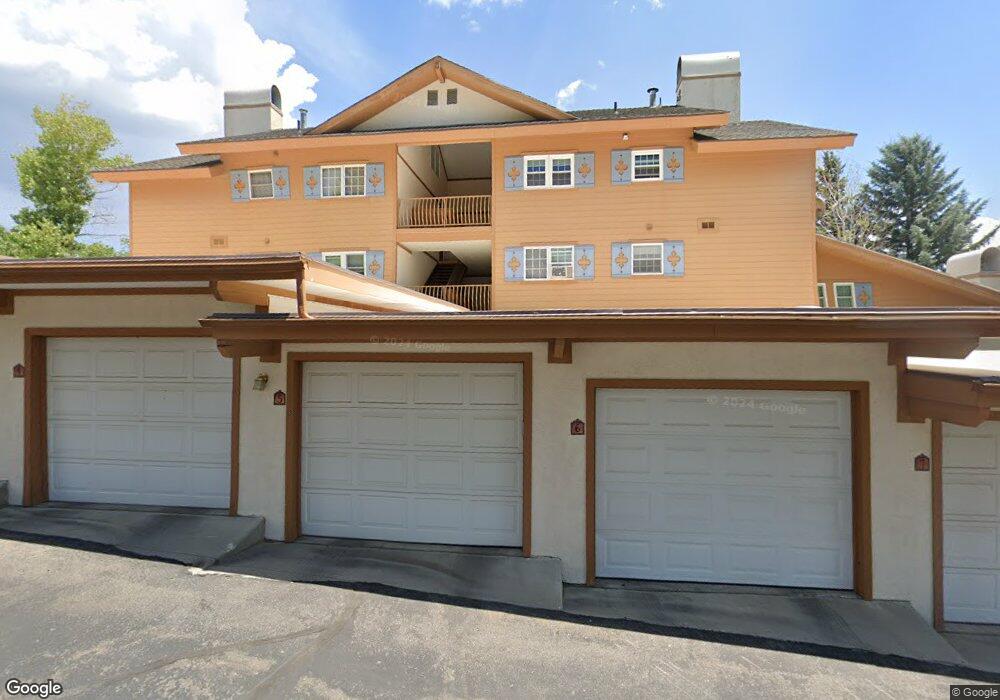
939 Schneitter Cir Unit I-5 Midway, UT 84049
Estimated Value: $428,000 - $521,000
2
Beds
--
Bath
1,200
Sq Ft
$393/Sq Ft
Est. Value
About This Home
This home is located at 939 Schneitter Cir Unit I-5, Midway, UT 84049 and is currently estimated at $471,051, approximately $392 per square foot. 939 Schneitter Cir Unit I-5 is a home located in Wasatch County with nearby schools including Midway Elementary School, Rocky Mountain Middle School, and Wasatch High School.
Ownership History
Date
Name
Owned For
Owner Type
Purchase Details
Closed on
Dec 8, 2016
Sold by
Miller Joseph R and Mctee Shelly
Bought by
Lemon Michael J
Current Estimated Value
Home Financials for this Owner
Home Financials are based on the most recent Mortgage that was taken out on this home.
Original Mortgage
$177,600
Outstanding Balance
$143,187
Interest Rate
3.47%
Mortgage Type
New Conventional
Estimated Equity
$327,864
Purchase Details
Closed on
Apr 28, 2015
Sold by
Vickers Phillip A
Bought by
Mctee Shelly
Purchase Details
Closed on
Apr 12, 2012
Sold by
Vickers Philip A and Miller Joseph R
Bought by
Vickers Philip A and Miller Joseph R
Purchase Details
Closed on
Mar 9, 2012
Sold by
Ingles Mary K
Bought by
Vickers Philip A and Miller Joseph R
Purchase Details
Closed on
Jan 10, 2007
Sold by
Bailey Michael S and Bailey Allyn S
Bought by
Ingles Mary K
Create a Home Valuation Report for This Property
The Home Valuation Report is an in-depth analysis detailing your home's value as well as a comparison with similar homes in the area
Home Values in the Area
Average Home Value in this Area
Purchase History
| Date | Buyer | Sale Price | Title Company |
|---|---|---|---|
| Lemon Michael J | -- | First American Title Insuran | |
| Mctee Shelly | -- | Us Title | |
| Vickers Philip A | -- | Us Title Park City | |
| Vickers Philip A | -- | Us Title Park City | |
| Ingles Mary K | -- | Atlas Title Insurance |
Source: Public Records
Mortgage History
| Date | Status | Borrower | Loan Amount |
|---|---|---|---|
| Open | Lemon Michael J | $177,600 |
Source: Public Records
Tax History Compared to Growth
Tax History
| Year | Tax Paid | Tax Assessment Tax Assessment Total Assessment is a certain percentage of the fair market value that is determined by local assessors to be the total taxable value of land and additions on the property. | Land | Improvement |
|---|---|---|---|---|
| 2025 | $2,914 | $462,000 | $0 | $462,000 |
| 2024 | $2,361 | $357,000 | $0 | $357,000 |
| 2023 | $2,361 | $293,800 | $0 | $293,800 |
| 2022 | $1,620 | $293,800 | $0 | $293,800 |
| 2021 | $1,650 | $231,150 | $0 | $231,150 |
| 2020 | $2,047 | $231,150 | $0 | $231,150 |
| 2019 | $1,556 | $127,133 | $0 | $0 |
| 2018 | $2,482 | $202,763 | $0 | $0 |
| 2017 | $2,453 | $199,220 | $0 | $0 |
| 2016 | $1,709 | $135,388 | $0 | $0 |
| 2015 | $1,624 | $135,388 | $25,000 | $110,388 |
| 2014 | $1,435 | $117,418 | $25,000 | $92,418 |
Source: Public Records
Map
Nearby Homes
- 954 Schneitter Cir Unit 4
- 918 Schneitter Cir Unit 2
- 901 Schneitter Cir Unit 7
- 952 Schneitter Cir
- 874 Schneitter Cir Unit 1
- 1057 Oberland Dr Unit A
- 798 N 800 W Unit 8
- 784 Resort Dr Unit 234
- 840 Bigler Ln Unit 1010
- 840 Bigler Ln Unit 3008
- 840 Bigler Ln Unit 341
- 840 Bigler Ln Unit 201
- 840 Bigler Ln Unit 201 (2001/2003)
- 840 Bigler Ln Unit 3022
- 840 Bigler Ln Unit 142
- 784 W Resort Dr Unit 206
- 840 W Bigler Unit 1033
- 840 W Bigler Unit 1012
- 840 W Bigler Unit 341
- 840 W Bigler Unit 3019
- 939 Schneitter Cir Unit 7
- 939 Schneitter Cir Unit 6
- 939 Schneitter Cir Unit 5
- 939 Schneitter Cir Unit 4
- 939 Schneitter Cir Unit 3
- 939 Schneitter Cir Unit 2
- 939 Schneitter Cir Unit 1
- 939 Schneitter Cir Unit 8
- 939 W Schneiter Cir Unit I-7
- 939 W Schneiter Cir Unit I-4
- 939 W Schneiter Cir Unit 5
- 939 W Schneiter Cir
- 939 W Schneiter Cir Unit 1-5
- 939 W Schneiter Cir Unit I-5
- 939 Schneitter Cir
- 939 Schneitters Circle I 2 Unit I-2
- 901 W Schneitter Cir Unit 4
- 917 Swiss Oaks Dr Unit 2
- 915 Swiss Oaks Dr Unit 1
- 954 Schneitter Cir Unit 6