939 Seapowet Ave Tiverton, RI 02878
South Tiverton NeighborhoodEstimated Value: $1,547,500 - $1,762,000
4
Beds
3
Baths
2,703
Sq Ft
$610/Sq Ft
Est. Value
About This Home
This home is located at 939 Seapowet Ave, Tiverton, RI 02878 and is currently estimated at $1,648,125, approximately $609 per square foot. 939 Seapowet Ave is a home located in Newport County with nearby schools including Tiverton High School.
Ownership History
Date
Name
Owned For
Owner Type
Purchase Details
Closed on
Aug 1, 2014
Sold by
Edgar A Kelley Ret
Bought by
Doyle Brian C and Doyle Dina Y
Current Estimated Value
Home Financials for this Owner
Home Financials are based on the most recent Mortgage that was taken out on this home.
Original Mortgage
$530,000
Outstanding Balance
$405,178
Interest Rate
4.18%
Estimated Equity
$1,242,947
Create a Home Valuation Report for This Property
The Home Valuation Report is an in-depth analysis detailing your home's value as well as a comparison with similar homes in the area
Home Values in the Area
Average Home Value in this Area
Purchase History
| Date | Buyer | Sale Price | Title Company |
|---|---|---|---|
| Doyle Brian C | $625,000 | -- |
Source: Public Records
Mortgage History
| Date | Status | Borrower | Loan Amount |
|---|---|---|---|
| Open | Doyle Brian C | $530,000 |
Source: Public Records
Tax History Compared to Growth
Tax History
| Year | Tax Paid | Tax Assessment Tax Assessment Total Assessment is a certain percentage of the fair market value that is determined by local assessors to be the total taxable value of land and additions on the property. | Land | Improvement |
|---|---|---|---|---|
| 2025 | $13,967 | $1,264,000 | $491,100 | $772,900 |
| 2024 | $13,967 | $1,264,000 | $491,100 | $772,900 |
| 2023 | $11,501 | $771,900 | $342,000 | $429,900 |
| 2022 | $11,274 | $770,600 | $342,000 | $428,600 |
| 2021 | $10,996 | $770,600 | $342,000 | $428,600 |
| 2020 | $10,587 | $653,900 | $192,100 | $461,800 |
| 2019 | $9,536 | $603,900 | $192,100 | $411,800 |
| 2018 | $9,898 | $603,900 | $192,100 | $411,800 |
| 2017 | $8,534 | $448,000 | $165,000 | $283,000 |
| 2016 | $8,575 | $448,000 | $165,000 | $283,000 |
| 2015 | $8,303 | $433,800 | $165,000 | $268,800 |
| 2014 | $8,571 | $444,100 | $165,000 | $279,100 |
Source: Public Records
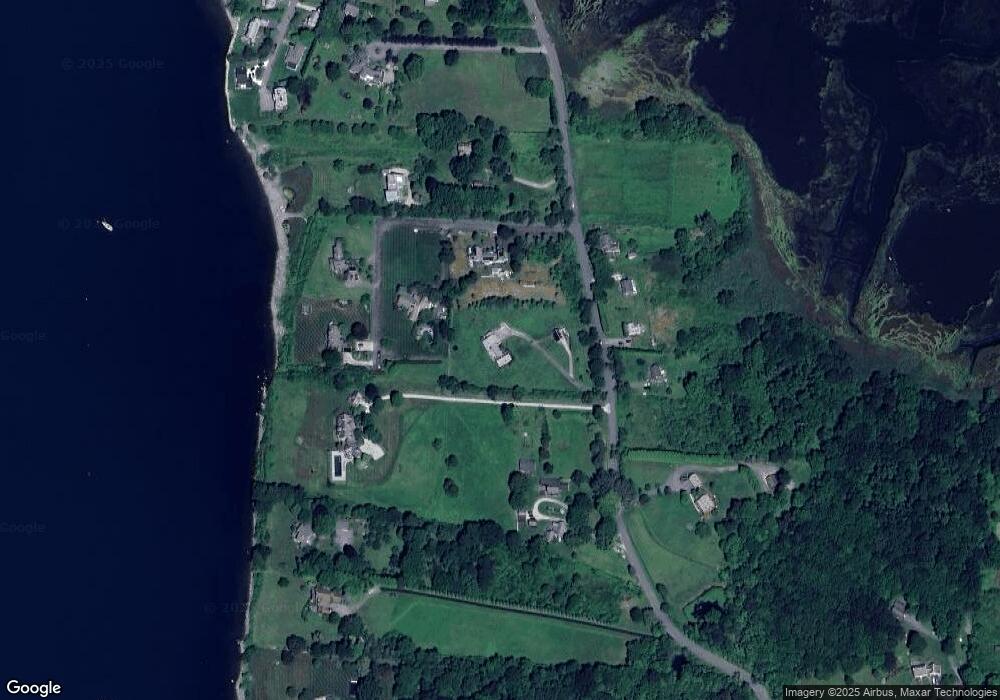
Map
Nearby Homes
- 24 Little Harbor Rd
- 40 Little Harbor Rd
- 940 Seapowet Ave
- 934 Seapowet Ave
- 961 Seapowet Ave
- 930 Seapowet Ave
- 87 Little Harbor Rd
- 952 Seapowet Ave
- 63 Little Harbor Rd
- 143 Lot 0 Seapowet Ave
- 991 Seapowet Ave
- 891 Seapowet Ave
- 143 Seapowet Ave
- 887 Seapowet Ave
- 996 Seapowet Ave
- 877 Seapowet Ave
- 1013 Seapowet Ave
- 1027 Seapowet Ave
- 865 Seapowet Ave
- 135 Driftwood Dr