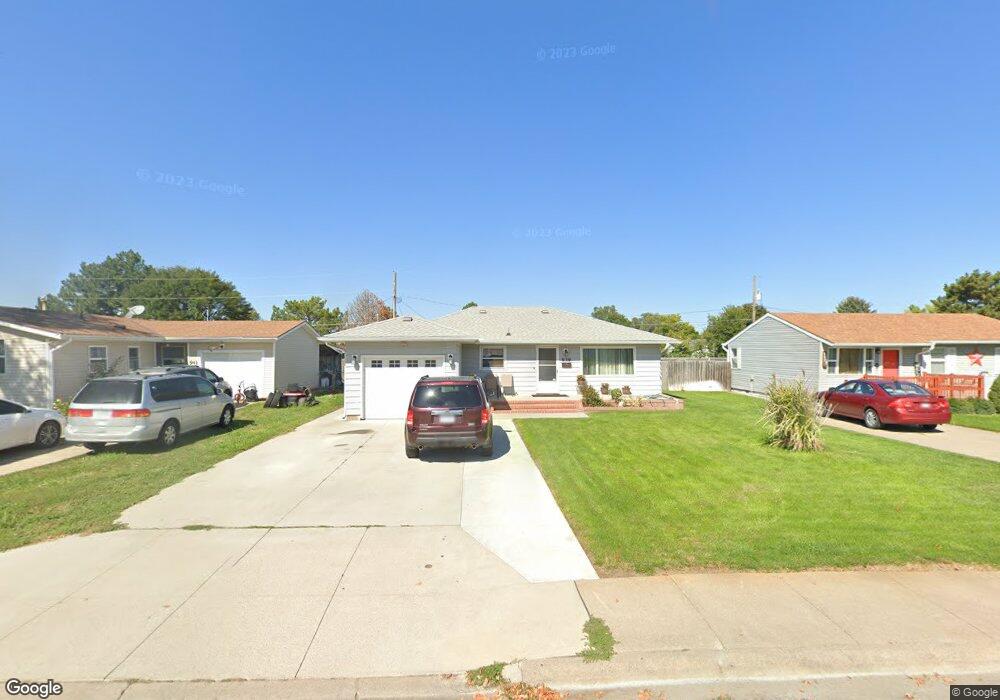
939 W 11th St Lexington, NE 68850
Estimated Value: $167,337 - $190,000
3
Beds
1
Bath
1,064
Sq Ft
$168/Sq Ft
Est. Value
About This Home
This home is located at 939 W 11th St, Lexington, NE 68850 and is currently estimated at $178,834, approximately $168 per square foot. 939 W 11th St is a home located in Dawson County with nearby schools including Lexington High School.
Ownership History
Date
Name
Owned For
Owner Type
Purchase Details
Closed on
Nov 20, 2020
Sold by
Bliven James A and Bliven Mary Ann
Bought by
Arreaga Ricardo
Current Estimated Value
Home Financials for this Owner
Home Financials are based on the most recent Mortgage that was taken out on this home.
Original Mortgage
$92,000
Outstanding Balance
$81,867
Interest Rate
2.8%
Mortgage Type
New Conventional
Estimated Equity
$96,967
Purchase Details
Closed on
Dec 17, 2014
Sold by
Nelsen Leonard G and Nelsen Linda E
Bought by
Bliven James A and Bliven Maryann
Purchase Details
Closed on
Sep 10, 2014
Sold by
Nelsen Leonard G and Nelsen Linda E
Bought by
Nelsen Leonard G and Nelsen Linda E
Purchase Details
Closed on
Jun 4, 2009
Sold by
Bucholz Darlene M
Bought by
Nelsen Leonard G
Home Financials for this Owner
Home Financials are based on the most recent Mortgage that was taken out on this home.
Original Mortgage
$32,000
Interest Rate
4.7%
Mortgage Type
New Conventional
Create a Home Valuation Report for This Property
The Home Valuation Report is an in-depth analysis detailing your home's value as well as a comparison with similar homes in the area
Home Values in the Area
Average Home Value in this Area
Purchase History
| Date | Buyer | Sale Price | Title Company |
|---|---|---|---|
| Arreaga Ricardo | $115,000 | None Available | |
| Bliven James A | $55,000 | None Available | |
| Nelsen Leonard G | -- | None Available | |
| Nelsen Leonard G | $40,000 | None Available |
Source: Public Records
Mortgage History
| Date | Status | Borrower | Loan Amount |
|---|---|---|---|
| Open | Arreaga Ricardo | $92,000 | |
| Previous Owner | Nelsen Leonard G | $32,000 |
Source: Public Records
Tax History Compared to Growth
Tax History
| Year | Tax Paid | Tax Assessment Tax Assessment Total Assessment is a certain percentage of the fair market value that is determined by local assessors to be the total taxable value of land and additions on the property. | Land | Improvement |
|---|---|---|---|---|
| 2024 | $1,346 | $105,250 | $7,350 | $97,900 |
| 2023 | $1,597 | $95,555 | $7,350 | $88,205 |
| 2022 | $1,517 | $83,768 | $7,350 | $76,418 |
| 2021 | $1,385 | $76,820 | $7,350 | $69,470 |
| 2020 | $1,256 | $69,224 | $7,350 | $61,874 |
| 2019 | $969 | $54,178 | $5,072 | $49,106 |
| 2018 | $979 | $54,178 | $5,072 | $49,106 |
| 2017 | $987 | $54,178 | $5,072 | $49,106 |
| 2016 | $1,058 | $78,895 | $4,900 | $73,995 |
| 2015 | $1,033 | $55,844 | $4,900 | $50,944 |
| 2014 | $1,101 | $55,844 | $4,900 | $50,944 |
| 2013 | -- | $55,844 | $4,900 | $50,944 |
Source: Public Records
Map
Nearby Homes
- 109 Sunset Dr
- 1404 N Madison St
- 1210 N Lincoln St
- 2006 Ridgeway Dr
- 2006 Patriot Dr
- 105 Revere Cir
- 103 Revere Cir
- 101 Revere Cir
- 1808 Cleveland St
- 2020 Patriot Dr
- 2104 Patriot Dr
- 900 W Walnut St
- 1607 N Jackson St
- 312 E 6th St
- 1404 N Monroe St
- 1205 N Pierce St
- 509 N Fillmore St
- 1211 Garfield St
- 0 Ponderosa Dr
- Plum Creek Prky (Hwy 283) & W Prospect Rd