Estimated Value: $105,000 - $145,000
3
Beds
1
Bath
1,056
Sq Ft
$116/Sq Ft
Est. Value
About This Home
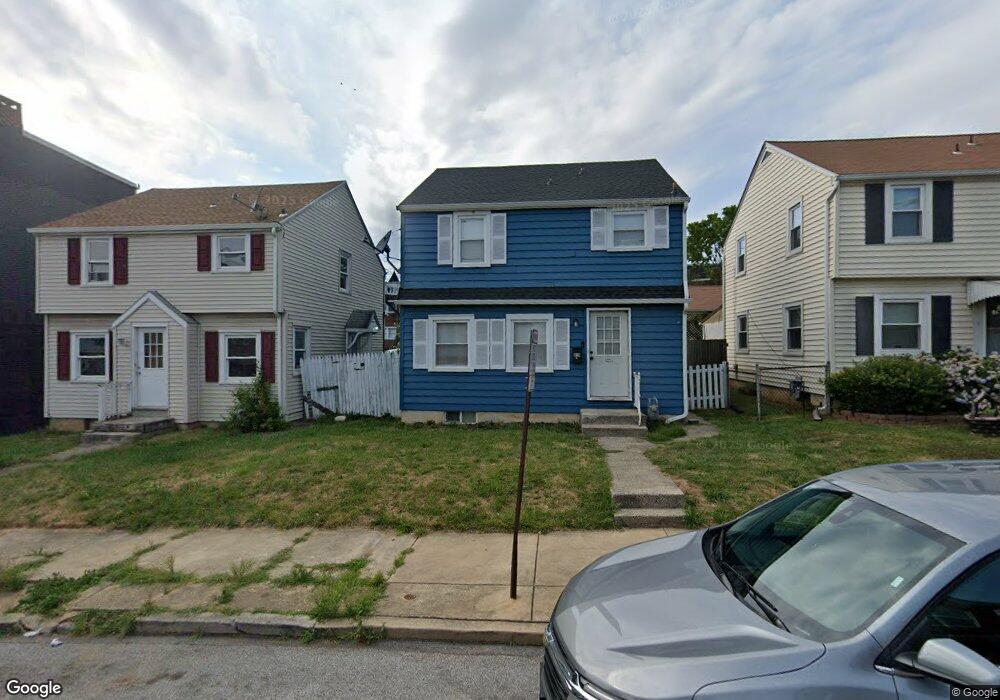
This home is located at 939 W Locust St, York, PA 17401 and is currently estimated at $123,010, approximately $116 per square foot. 939 W Locust St is a home located in York County with nearby schools including McKinley School, William Penn Senior High School, and Lincoln Charter School.
Ownership History
Date
Name
Owned For
Owner Type
Purchase Details
Closed on
Jul 24, 2024
Sold by
Lecompte Kenneth L and Lecompte Sharon G
Bought by
Bk Properties Ypa Llc
Current Estimated Value
Purchase Details
Closed on
Oct 22, 2002
Sold by
Hud
Bought by
Lecompte Kenneth
Purchase Details
Closed on
Jul 10, 2002
Sold by
Delvalle Oscar and Ortiz Virgen
Bought by
Wells Fargo Home Mtg Inc
Purchase Details
Closed on
Jan 20, 2000
Sold by
Roth James K and Roth Patricia L
Bought by
Delvalle Oscar and Ortiz Virgen M
Home Financials for this Owner
Home Financials are based on the most recent Mortgage that was taken out on this home.
Original Mortgage
$62,967
Interest Rate
7.91%
Mortgage Type
FHA
Purchase Details
Closed on
Apr 21, 1999
Sold by
Doyle Randy Lynn and Doyle Samantha Dacheux
Bought by
Roth James K and Roth Patricia L
Create a Home Valuation Report for This Property
The Home Valuation Report is an in-depth analysis detailing your home's value as well as a comparison with similar homes in the area
Home Values in the Area
Average Home Value in this Area
Purchase History
| Date | Buyer | Sale Price | Title Company |
|---|---|---|---|
| Bk Properties Ypa Llc | -- | None Listed On Document | |
| Lecompte Kenneth | $21,673 | -- | |
| Wells Fargo Home Mtg Inc | $1,469 | -- | |
| Delvalle Oscar | $63,000 | -- | |
| Roth James K | -- | -- |
Source: Public Records
Mortgage History
| Date | Status | Borrower | Loan Amount |
|---|---|---|---|
| Previous Owner | Delvalle Oscar | $62,967 |
Source: Public Records
Tax History Compared to Growth
Tax History
| Year | Tax Paid | Tax Assessment Tax Assessment Total Assessment is a certain percentage of the fair market value that is determined by local assessors to be the total taxable value of land and additions on the property. | Land | Improvement |
|---|---|---|---|---|
| 2025 | $2,257 | $35,720 | $8,220 | $27,500 |
| 2024 | $2,218 | $35,720 | $8,220 | $27,500 |
| 2023 | $2,218 | $35,720 | $8,220 | $27,500 |
| 2022 | $2,205 | $35,720 | $8,220 | $27,500 |
| 2021 | $2,144 | $35,720 | $8,220 | $27,500 |
| 2020 | $2,093 | $35,720 | $8,220 | $27,500 |
| 2019 | $2,090 | $35,720 | $8,220 | $27,500 |
| 2018 | $2,090 | $35,720 | $8,220 | $27,500 |
| 2017 | $2,118 | $35,720 | $8,220 | $27,500 |
| 2016 | -- | $44,480 | $8,220 | $36,260 |
| 2015 | $2,608 | $44,480 | $8,220 | $36,260 |
| 2014 | $2,608 | $44,480 | $8,220 | $36,260 |
Source: Public Records
Map
Nearby Homes
- 1023 W Locust St
- 908 W Princess St
- 919 W College Ave
- 932 W College Ave
- 908 W College Ave
- 921 W Poplar St
- 1111 W Princess St
- 1108 W College Ave
- 811 W Poplar St
- 1206 W Poplar St
- 1213 W College Ave
- 1211 W Poplar St
- 1221 W Poplar St
- 46 S Royal St
- 706 W Princess St
- 1126 W Market St
- 1250 W King St
- 19 Carlisle Ave
- 217 S West St
- 231 S West St
- 943 W Locust St
- 935 W Locust St
- 953 W Locust St
- 931 W Locust St
- 955 W Locust St
- 927 W Locust St
- 942 W Princess St
- 946 W Princess St
- 940 W Princess St
- 940 W Princess St Unit 2
- 948 W Princess St
- 0 Garage Unit 2 Heiges Ave
- 938 W Princess St
- 923 W Locust St
- 950 W Princess St
- 950 W Princess St Unit 2
- 950 W Princess St Unit 3
- 936 W Princess St
- 952 W Princess St
- 944 W Locust St