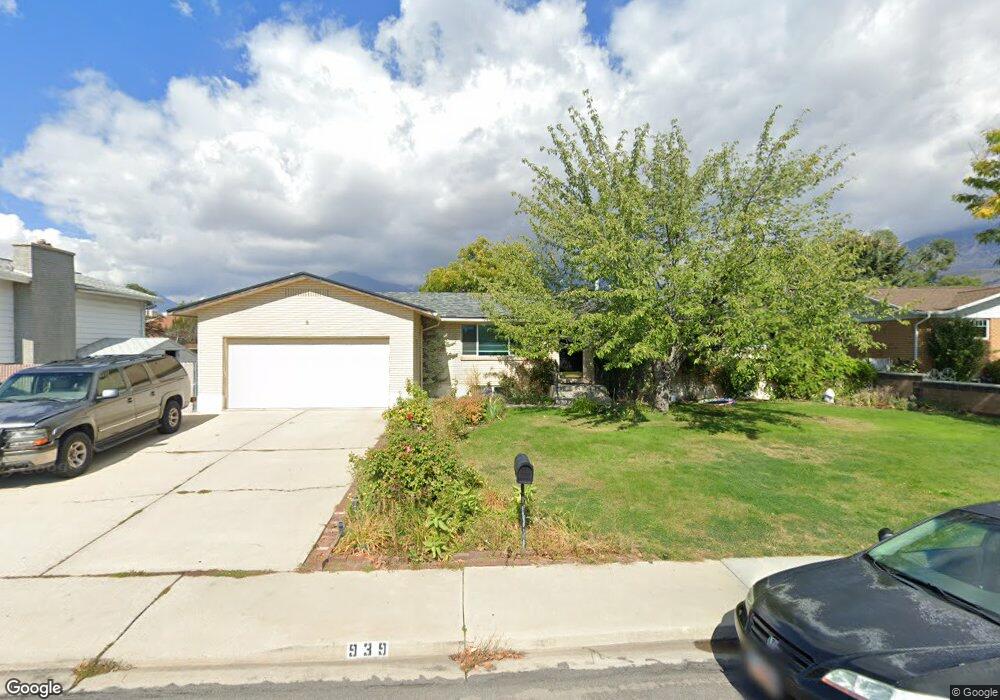
939 Zobell Dr Orem, UT 84097
Riverside NeighborhoodEstimated Value: $588,611 - $617,000
6
Beds
3
Baths
1,520
Sq Ft
$397/Sq Ft
Est. Value
About This Home
This home is located at 939 Zobell Dr, Orem, UT 84097 and is currently estimated at $603,870, approximately $397 per square foot. 939 Zobell Dr is a home located in Utah County with nearby schools including Centennial Elementary, Canyon View Junior High School, and Orem High School.
Ownership History
Date
Name
Owned For
Owner Type
Purchase Details
Closed on
Jan 16, 2015
Sold by
Kee Jeannette
Bought by
Kee Michael and Kee Jeannette
Current Estimated Value
Home Financials for this Owner
Home Financials are based on the most recent Mortgage that was taken out on this home.
Original Mortgage
$195,000
Outstanding Balance
$149,527
Interest Rate
3.87%
Mortgage Type
New Conventional
Estimated Equity
$454,343
Purchase Details
Closed on
May 7, 2003
Sold by
Riggs Shirley G
Bought by
Kee Michael and Kee Jeanette
Home Financials for this Owner
Home Financials are based on the most recent Mortgage that was taken out on this home.
Original Mortgage
$167,373
Interest Rate
5.84%
Mortgage Type
FHA
Create a Home Valuation Report for This Property
The Home Valuation Report is an in-depth analysis detailing your home's value as well as a comparison with similar homes in the area
Home Values in the Area
Average Home Value in this Area
Purchase History
| Date | Buyer | Sale Price | Title Company |
|---|---|---|---|
| Kee Michael | -- | Atlas Title | |
| Kee Jeannette | -- | Atlas Title | |
| Kee Michael | -- | Title West Title Company |
Source: Public Records
Mortgage History
| Date | Status | Borrower | Loan Amount |
|---|---|---|---|
| Open | Kee Michael | $195,000 | |
| Closed | Kee Michael | $167,373 |
Source: Public Records
Tax History
| Year | Tax Paid | Tax Assessment Tax Assessment Total Assessment is a certain percentage of the fair market value that is determined by local assessors to be the total taxable value of land and additions on the property. | Land | Improvement |
|---|---|---|---|---|
| 2025 | $2,365 | $292,765 | -- | -- |
| 2024 | $2,365 | $289,190 | $0 | $0 |
| 2023 | $2,239 | $294,305 | $0 | $0 |
| 2022 | $2,230 | $283,910 | $0 | $0 |
| 2021 | $1,933 | $372,800 | $166,600 | $206,200 |
| 2020 | $1,750 | $331,600 | $133,300 | $198,300 |
| 2019 | $1,615 | $318,400 | $122,800 | $195,600 |
| 2018 | $1,514 | $285,200 | $112,200 | $173,000 |
| 2017 | $1,412 | $142,450 | $0 | $0 |
| 2016 | $1,358 | $126,335 | $0 | $0 |
| 2015 | $1,325 | $116,600 | $0 | $0 |
| 2014 | $1,176 | $102,960 | $0 | $0 |
Source: Public Records
Map
Nearby Homes
Your Personal Tour Guide
Ask me questions while you tour the home.