9391 Clay Station Rd Wilton, CA 95693
Estimated Value: $1,254,178 - $1,836,000
About This Home
This home is located at 9391 Clay Station Rd, Wilton, CA 95693 and is currently estimated at $1,506,295, approximately $419 per square foot. 9391 Clay Station Rd is a home located in Sacramento County with nearby schools including C.W. Dillard Elementary School, Katherine L. Albiani Middle School, and Pleasant Grove High School.
Ownership History
We collect this data history from publicly available records. To have your information removed, we recommend requesting removal directly through your county’s website.
Purchase Details
Purchase Details
Purchase Details
Purchase Details
Home Financials for this Owner
Home Financials are based on the most recent Mortgage that was taken out on this home.Home Values in the Area
Average Home Value in this Area
Purchase History
We collect this data history from publicly available records. To have your information removed, we recommend requesting removal directly through your county’s website.
| Date | Buyer | Sale Price | Title Company |
|---|---|---|---|
| -- | Alliance Title Company | ||
| -- | Alliance Title Company | ||
| -- | -- | ||
| $412,000 | North American Title Guarant |
Mortgage History
We collect this data history from publicly available records. To have your information removed, we recommend requesting removal directly through your county’s website.
| Date | Status | Borrower | Loan Amount |
|---|---|---|---|
| Open | $328,000 |
Tax History
We collect this data history from publicly available records. To have your information removed, we recommend requesting removal directly through your county’s website.
| Year | Tax Paid | Tax Assessment Tax Assessment Total Assessment is a certain percentage of the fair market value that is determined by local assessors to be the total taxable value of land and additions on the property. | Land | Improvement |
|---|---|---|---|---|
| 2025 | $8,640 | $809,866 | $235,144 | $574,722 |
| 2024 | $8,570 | $793,987 | $230,534 | $563,453 |
| 2023 | $8,291 | $778,419 | $226,014 | $552,405 |
| 2022 | $8,145 | $763,157 | $221,583 | $541,574 |
| 2021 | $8,080 | $748,194 | $217,239 | $530,955 |
| 2020 | $7,861 | $740,523 | $215,012 | $525,511 |
| 2019 | $7,712 | $726,004 | $210,797 | $515,207 |
| 2018 | $7,495 | $711,769 | $206,664 | $505,105 |
| 2017 | $7,359 | $697,813 | $202,612 | $495,201 |
| 2016 | $6,968 | $684,132 | $198,640 | $485,492 |
| 2015 | $6,830 | $673,857 | $195,657 | $478,200 |
| 2014 | $6,711 | $660,658 | $191,825 | $468,833 |
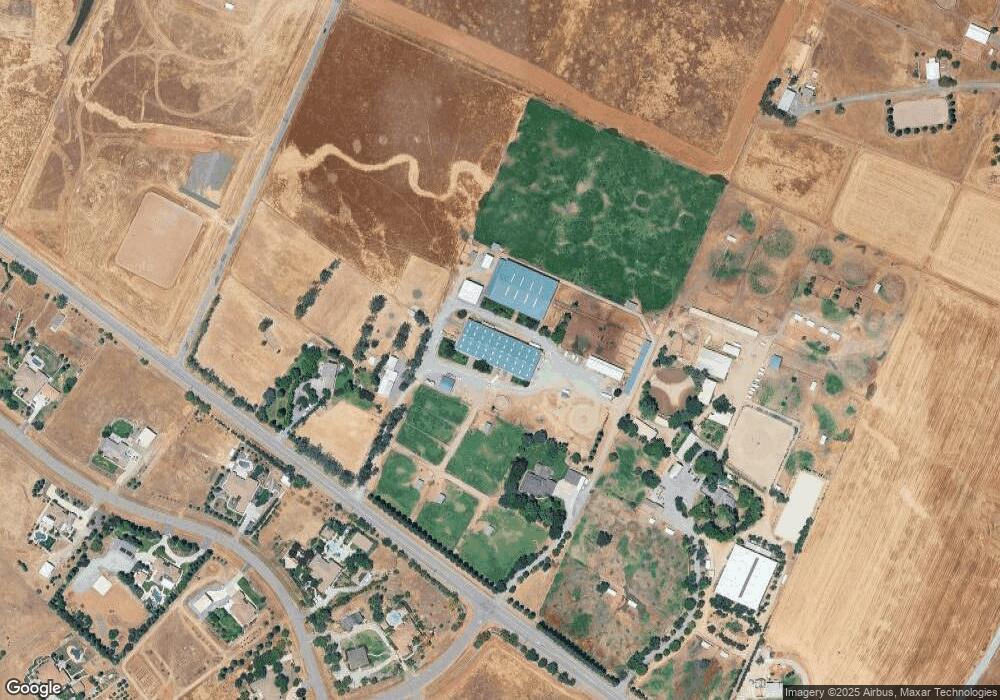
Map
- 12700 Rimfire Dr
- 12501 Lee School Cross Rd
- 10310 Clay Station Rd
- 8960 Dillard Rd
- 12493 Plum Ln
- 0 Kiwi Ln
- 13088 Cherry Rd
- 0 Alta Mesa Rd Unit 224117427
- 12105 Rising Rd
- 12702 Tessie Place
- 10125 La Clair Rd
- 9475 Alta Mesa Rd
- 0 Colony Hill Ln
- 7770 Dillard Rd
- 13850 Meiss Rd
- 7788 Dillard Rd
- 0 Parcel D Unit 226059596
- #1 Alta Mesa Rd
- 11671 Walmort Rd
- 0 Woods Rd Unit 226052805
- 9327 Clay Station Rd
- 13001 Rimfire Dr
- 12991 Rimfire Dr
- 9985 Stablegate Rd
- 9439 Clay Station Rd
- 13000 Rimfire Dr
- 12971 Rimfire Dr
- 12990 Rimfire Dr
- 9971 Stablegate Rd
- 9971 Stablegate Rd
- 9459 Clay Station Rd
- 12951 Rimfire Dr
- 12970 Rimfire Dr
- 9231 Voula Ln
- 13001 Barbaro Ct
- 12940 Rimfire Dr
- 12931 Rimfire Dr
- 13021 Barbaro Ct
- 9459 Sidesaddle Dr
- 9479 Sidesaddle Dr
Ask me questions while you tour the home.