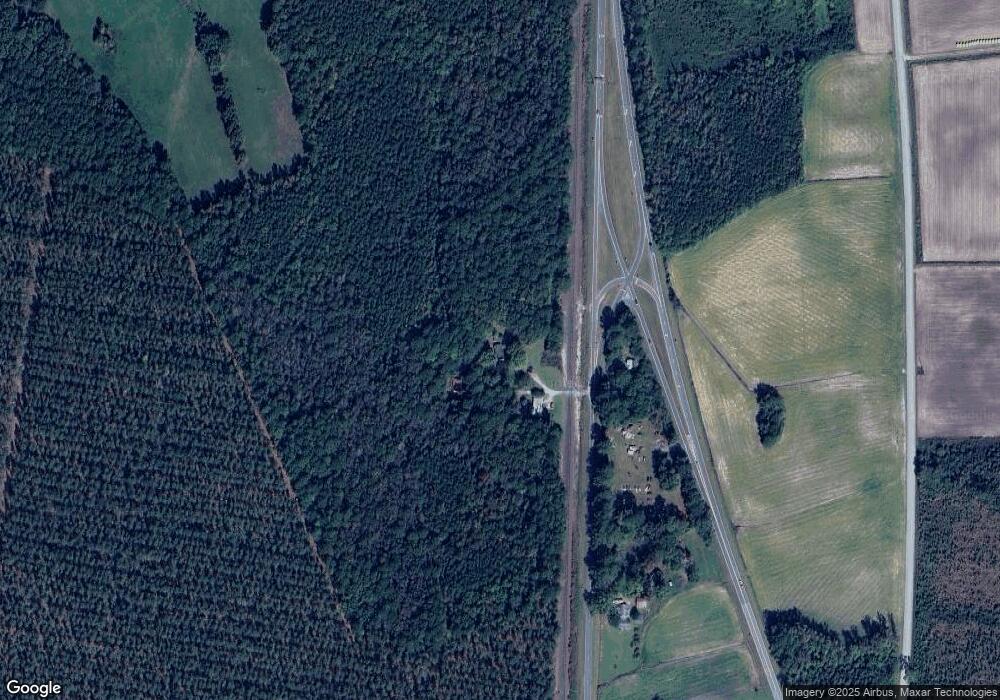
9395 Main St Vanceboro, NC 28586
Estimated Value: $148,000 - $320,553
5
Beds
5
Baths
1,080
Sq Ft
$213/Sq Ft
Est. Value
About This Home
This home is located at 9395 Main St, Vanceboro, NC 28586 and is currently estimated at $230,138, approximately $213 per square foot. 9395 Main St is a home located in Craven County with nearby schools including Vanceboro-Farm Life Elementary School, West Craven Middle School, and West Craven High School.
Ownership History
Date
Name
Owned For
Owner Type
Purchase Details
Closed on
Jan 16, 2025
Sold by
Campbell Mary Lee
Bought by
Campbell Mary Lee and Campbell Menville
Current Estimated Value
Purchase Details
Closed on
Jan 9, 2002
Sold by
Staten Liz and Staten Melvin
Bought by
Campbell Mary Lee
Purchase Details
Closed on
May 23, 1982
Sold by
Staten Alice Hrs
Bought by
Campbell Mary Lee
Create a Home Valuation Report for This Property
The Home Valuation Report is an in-depth analysis detailing your home's value as well as a comparison with similar homes in the area
Home Values in the Area
Average Home Value in this Area
Purchase History
| Date | Buyer | Sale Price | Title Company |
|---|---|---|---|
| Campbell Mary Lee | -- | None Listed On Document | |
| Campbell Mary Lee | -- | None Listed On Document | |
| Campbell Mary Lee | -- | None Available | |
| Campbell Mary Lee | -- | -- |
Source: Public Records
Tax History Compared to Growth
Tax History
| Year | Tax Paid | Tax Assessment Tax Assessment Total Assessment is a certain percentage of the fair market value that is determined by local assessors to be the total taxable value of land and additions on the property. | Land | Improvement |
|---|---|---|---|---|
| 2025 | $720 | $139,510 | $13,950 | $125,560 |
| 2024 | $506 | $134,470 | $13,950 | $120,520 |
| 2023 | $494 | $93,330 | $13,950 | $79,380 |
| 2022 | $386 | $55,740 | $13,950 | $41,790 |
| 2021 | $386 | $55,740 | $13,950 | $41,790 |
| 2020 | $381 | $55,740 | $13,950 | $41,790 |
| 2019 | $381 | $55,740 | $13,950 | $41,790 |
| 2018 | $352 | $55,740 | $13,950 | $41,790 |
| 2017 | $352 | $55,740 | $13,950 | $41,790 |
| 2016 | $352 | $62,370 | $13,950 | $48,420 |
| 2015 | $343 | $62,370 | $13,950 | $48,420 |
| 2014 | $343 | $62,370 | $13,950 | $48,420 |
Source: Public Records
Map
Nearby Homes