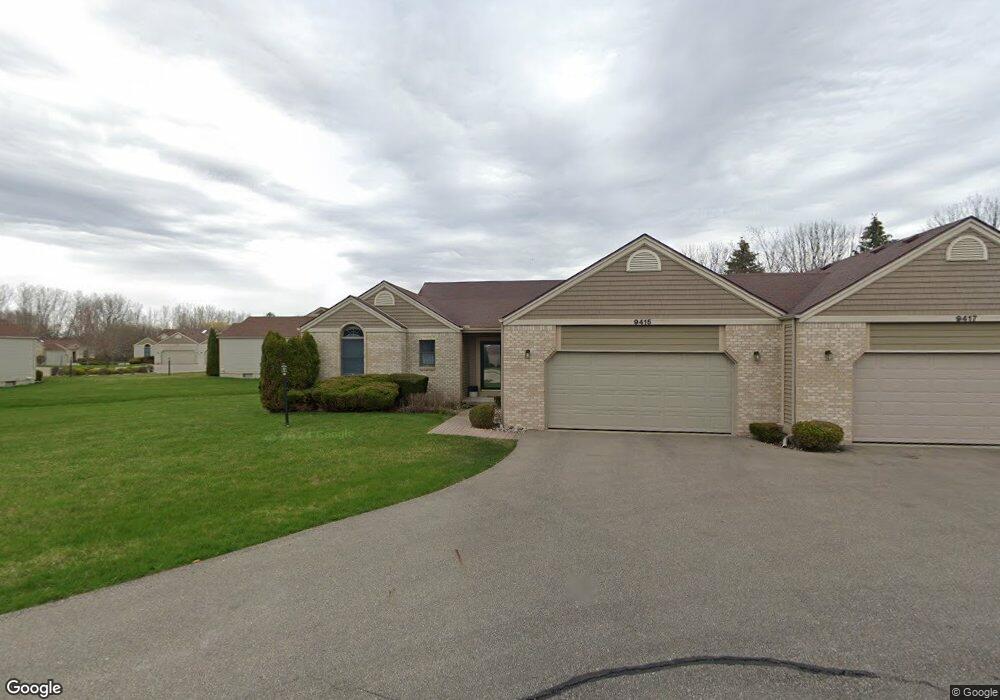
9396 Sycamore Ct Unit 16 Davison, MI 48423
Estimated Value: $201,000 - $226,000
2
Beds
3
Baths
1,214
Sq Ft
$176/Sq Ft
Est. Value
About This Home
This home is located at 9396 Sycamore Ct Unit 16, Davison, MI 48423 and is currently estimated at $213,380, approximately $175 per square foot. 9396 Sycamore Ct Unit 16 is a home located in Genesee County with nearby schools including Thomson Elementary School, Hill Elementary School, and Siple Elementary School.
Ownership History
Date
Name
Owned For
Owner Type
Purchase Details
Closed on
Oct 31, 2022
Sold by
Ratcliff Lisa
Bought by
Lisa D Ratcliff Living Trust
Current Estimated Value
Purchase Details
Closed on
Oct 27, 2020
Sold by
Arbor Creek Of Davison and Forest Creek Condominium Of Davison Asso
Bought by
Ratcliff Lisa
Purchase Details
Closed on
Sep 2, 2020
Sold by
Cone Robert D and Cone Lestee D
Bought by
H P Fourbsuere Solutions
Purchase Details
Closed on
Feb 13, 2019
Sold by
Cone Robert D and Cone Leslee D
Bought by
Forest Creek Condominium Of Davison Assn and Arbor Creek Of Davison
Purchase Details
Closed on
Aug 16, 2016
Sold by
Cone Robert D and Cone Leslee D
Bought by
Cone Robert D and Cone Leslee D
Purchase Details
Closed on
Jan 17, 2003
Sold by
Sikkema Dale R and Sikkema Kristine
Bought by
Cone Robert D and Cone Leslee D
Home Financials for this Owner
Home Financials are based on the most recent Mortgage that was taken out on this home.
Original Mortgage
$154,755
Interest Rate
5.94%
Create a Home Valuation Report for This Property
The Home Valuation Report is an in-depth analysis detailing your home's value as well as a comparison with similar homes in the area
Home Values in the Area
Average Home Value in this Area
Purchase History
| Date | Buyer | Sale Price | Title Company |
|---|---|---|---|
| Lisa D Ratcliff Living Trust | -- | -- | |
| Ratcliff Lisa | $122,000 | Transnation Title | |
| H P Fourbsuere Solutions | $105,000 | None Available | |
| Forest Creek Condominium Of Davison Assn | $5,981 | None Available | |
| Cone Robert D | -- | None Available | |
| Cone Robert D | $162,900 | Lawyers Title |
Source: Public Records
Mortgage History
| Date | Status | Borrower | Loan Amount |
|---|---|---|---|
| Previous Owner | Cone Robert D | $154,755 |
Source: Public Records
Tax History Compared to Growth
Tax History
| Year | Tax Paid | Tax Assessment Tax Assessment Total Assessment is a certain percentage of the fair market value that is determined by local assessors to be the total taxable value of land and additions on the property. | Land | Improvement |
|---|---|---|---|---|
| 2025 | $3,118 | $95,100 | $0 | $0 |
| 2024 | $938 | $92,100 | $0 | $0 |
| 2023 | $895 | $86,600 | $0 | $0 |
| 2022 | $2,786 | $74,200 | $0 | $0 |
| 2021 | $2,761 | $71,700 | $0 | $0 |
| 2020 | $799 | $69,000 | $0 | $0 |
| 2019 | $568 | $65,100 | $0 | $0 |
| 2018 | $1,932 | $60,800 | $0 | $0 |
| 2017 | $1,670 | $60,800 | $0 | $0 |
| 2016 | $1,649 | $56,400 | $0 | $0 |
| 2015 | $1,357 | $52,400 | $0 | $0 |
| 2014 | $524 | $45,500 | $0 | $0 |
| 2012 | -- | $45,400 | $45,400 | $0 |
Source: Public Records
Map
Nearby Homes
- 9413 Blue Spruce Ct Unit 54
- 3369 Meadow Ridge Ct
- 3367 Meadow Ridge Ct
- 3372 Spruceridge Ct Unit 82
- 3365 Spruceridge Ct Unit 78
- 9805 E Richfield Rd
- 4078 N State Rd
- 3371 Meadowridge Ct Unit 107
- 9100 Dublin Way
- 9508 Orchard Lake Dr
- 9520 Orchard Lake Dr
- 10190 Hunt Dr
- 9440 E Potter Rd
- 4063 N Gale Rd
- 255 Roosevelt Dr
- 0 N State Rd Unit 20250007293
- 7040 N Oak Rd
- 2351 Baltimore
- 2239 Baltimore Ln
- 7120 N Oak Rd
- 9398 Sycamore Ct
- 9394 Sycamore Ct Unit 17
- 9403 Pineview Ct Unit 12
- 9397 Sycamore Ct
- 9397 Sycamore Ct Unit 14
- 9422 Mountain Ash Ct Unit 66
- 9424 Mountain Ash Ct Unit 65
- 9392 Sycamore Ct
- 9395 Sycamore Ct Unit 13
- 9405 Pineview Ct Unit 11
- 9420 Mountain Ash Ct Unit 67
- 9402 Pineview Ct Unit 10
- 9391 Sycamore Ct
- 9391 Sycamore Ct Unit 19
- 9406 Blue Spruce Ct
- 9393 Sycamore Ct Unit 20
- 9404 Pineview Ct
- 9418 Mountain Ash Ct Unit 68
- 9413 Grandview Ct Unit 50
- 9413 N Grandview Ct