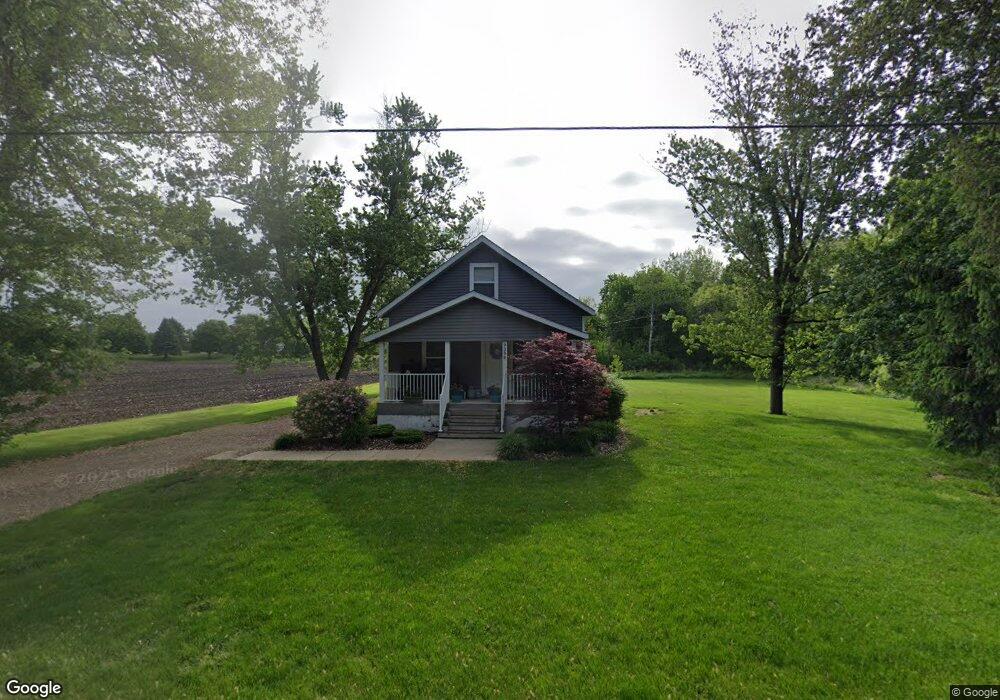
9398 Byron Center Ave SW Byron Center, MI 49315
Estimated Value: $320,000 - $515,000
3
Beds
2
Baths
1,300
Sq Ft
$319/Sq Ft
Est. Value
About This Home
This home is located at 9398 Byron Center Ave SW, Byron Center, MI 49315 and is currently estimated at $415,121, approximately $319 per square foot. 9398 Byron Center Ave SW is a home located in Kent County with nearby schools including Robert L. Nickels Intermediate School, Brown Elementary School, and Byron Center West Middle School.
Ownership History
Date
Name
Owned For
Owner Type
Purchase Details
Closed on
Jan 3, 2019
Sold by
Bhayana Parveer
Bought by
Mji Properties Llc
Current Estimated Value
Purchase Details
Closed on
Apr 28, 2010
Sold by
Marlea Properties Llc
Bought by
Bhayana Parveer
Home Financials for this Owner
Home Financials are based on the most recent Mortgage that was taken out on this home.
Original Mortgage
$94,897
Interest Rate
5.05%
Mortgage Type
Commercial
Purchase Details
Closed on
Sep 17, 2008
Sold by
Vankempen Robert C and Vankempen Patricia
Bought by
Wells Fargo Bank Na
Purchase Details
Closed on
Dec 31, 2003
Sold by
Vankempen Robert C and Johnson Patricia
Bought by
Vankempen Robert C and Vankempen Patricia
Home Financials for this Owner
Home Financials are based on the most recent Mortgage that was taken out on this home.
Original Mortgage
$112,000
Interest Rate
8.6%
Mortgage Type
Commercial
Create a Home Valuation Report for This Property
The Home Valuation Report is an in-depth analysis detailing your home's value as well as a comparison with similar homes in the area
Home Values in the Area
Average Home Value in this Area
Purchase History
| Date | Buyer | Sale Price | Title Company |
|---|---|---|---|
| Mji Properties Llc | $84,000 | Bridge Title Agency Llc | |
| Bhayana Parveer | $92,900 | None Available | |
| Wells Fargo Bank Na | $126,875 | None Available | |
| Vankempen Robert C | -- | None Available |
Source: Public Records
Mortgage History
| Date | Status | Borrower | Loan Amount |
|---|---|---|---|
| Previous Owner | Bhayana Parveer | $94,897 | |
| Previous Owner | Vankempen Robert C | $112,000 |
Source: Public Records
Tax History Compared to Growth
Tax History
| Year | Tax Paid | Tax Assessment Tax Assessment Total Assessment is a certain percentage of the fair market value that is determined by local assessors to be the total taxable value of land and additions on the property. | Land | Improvement |
|---|---|---|---|---|
| 2025 | $3,374 | $152,900 | $0 | $0 |
| 2024 | $3,374 | $139,400 | $0 | $0 |
| 2023 | $3,223 | $122,900 | $0 | $0 |
| 2022 | $4,936 | $101,400 | $0 | $0 |
| 2021 | $4,908 | $102,900 | $0 | $0 |
| 2020 | $3,026 | $99,100 | $0 | $0 |
| 2019 | $4,061 | $93,600 | $0 | $0 |
| 2018 | $3,925 | $88,100 | $43,800 | $44,300 |
| 2017 | $3,841 | $78,400 | $0 | $0 |
| 2016 | $2,364 | $0 | $0 | $0 |
| 2015 | $1,410 | $74,000 | $0 | $0 |
| 2013 | -- | $65,300 | $0 | $0 |
Source: Public Records
Map
Nearby Homes
- 9705 Byron Center Ave SW
- 2156 Center Grange Dr
- 8750 Lindsey Ln SW Unit 23
- 136 100th St SW
- 737 100th St SW
- 2599 Ridge Top Dr SW
- 1941 Conifer Ridge Dr SW
- 2267 Aimie Ave SW
- 1861 Restoration Dr SW
- 8608 Woodruff Dr SW
- 9277 Ivanrest Ave SW
- 8695 Bethany Dr SW
- 1768 Hightree Dr SW
- 8652 Bethany Dr SW
- 8638 Bethany Dr SW
- 8581 Troy St SW
- 8541 Woodhaven Dr SW
- 8564 Elkwood Dr SW
- 3370 92nd St SW
- 670 84th St SW
- 9401 Byron Center Ave SW
- 9350 Byron Center Ave SW
- 9468 Byron Center Ave SW
- 9495 Byron Center Ave SW
- 9300 Byron Center Ave SW
- 9270 Byron Center Ave SW
- 9551 Byron Center Ave SW
- 9594 Byron Center Ave SW
- 9230 Byron Center Ave SW
- 9212 Byron Center Ave SW
- 2382 92nd St SW
- 2362 92nd St SW
- 2350 92nd St SW
- 1100 92nd St SW
- 2383 92nd St SW
- 2363 92nd St SW
- 2524 92nd St SW
- 2254 92nd St SW
- 9636 Byron Center Ave SW
- 2311 92nd St SW