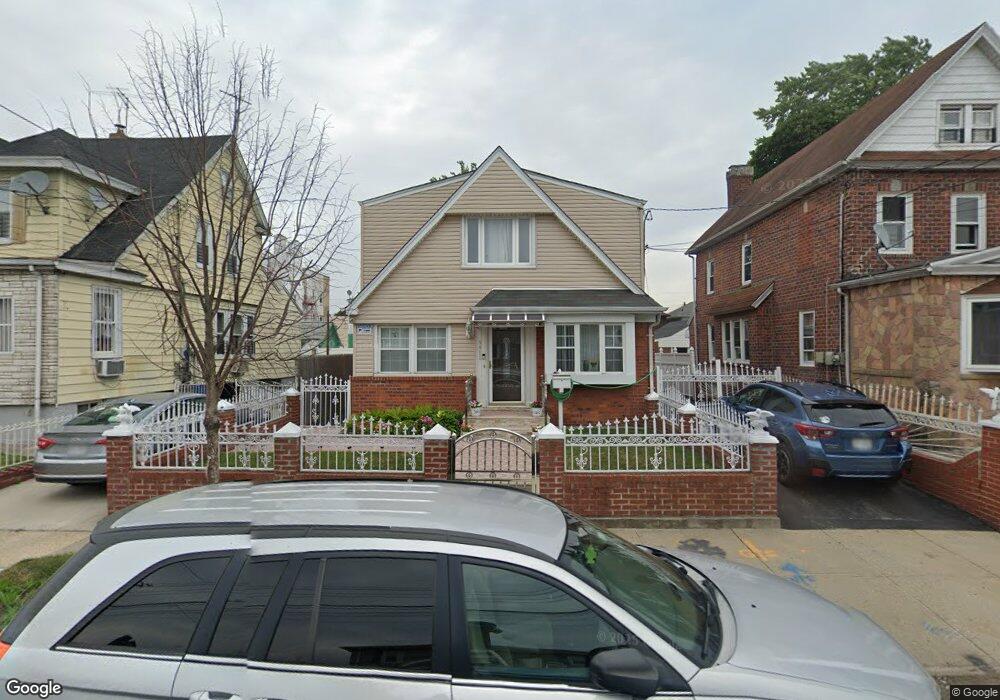
94-11 212th Place Queens Village, NY 11428
Queens Village NeighborhoodEstimated Value: $806,864 - $950,000
4
Beds
2
Baths
1,376
Sq Ft
$647/Sq Ft
Est. Value
About This Home
This home is located at 94-11 212th Place, Queens Village, NY 11428 and is currently estimated at $890,466, approximately $647 per square foot. 94-11 212th Place is a home located in Queens County with nearby schools including The Bellaire School, Jean Nuzzi Intermediate School, and Incarnation Catholic Academy.
Ownership History
Date
Name
Owned For
Owner Type
Purchase Details
Closed on
May 10, 2025
Sold by
Sewnauth Dinesh
Bought by
Sewnauth Dinesh and Sewnauth Seeroginee D
Current Estimated Value
Purchase Details
Closed on
Nov 29, 2000
Sold by
Saleem Fareena and Ally Kamar
Bought by
Pharay Ramrattie and Pharay Girjadayal
Home Financials for this Owner
Home Financials are based on the most recent Mortgage that was taken out on this home.
Original Mortgage
$273,600
Outstanding Balance
$100,824
Interest Rate
7.7%
Estimated Equity
$789,642
Purchase Details
Closed on
Jun 2, 1995
Sold by
Krusch Pauline E
Bought by
Saleem Fareena and Ally Kamar
Home Financials for this Owner
Home Financials are based on the most recent Mortgage that was taken out on this home.
Original Mortgage
$194,750
Interest Rate
5.25%
Create a Home Valuation Report for This Property
The Home Valuation Report is an in-depth analysis detailing your home's value as well as a comparison with similar homes in the area
Home Values in the Area
Average Home Value in this Area
Purchase History
| Date | Buyer | Sale Price | Title Company |
|---|---|---|---|
| Sewnauth Dinesh | -- | -- | |
| Pharay Ramrattie | $304,000 | Commonwealth Land Title Ins | |
| Pharay Ramrattie | $304,000 | Commonwealth Land Title Ins | |
| Saleem Fareena | $205,000 | Ticor Title Guarantee Compan | |
| Saleem Fareena | $205,000 | Ticor Title Guarantee Compan |
Source: Public Records
Mortgage History
| Date | Status | Borrower | Loan Amount |
|---|---|---|---|
| Open | Pharay Ramrattie | $273,600 | |
| Closed | Pharay Ramrattie | $273,600 | |
| Previous Owner | Saleem Fareena | $194,750 |
Source: Public Records
Tax History Compared to Growth
Tax History
| Year | Tax Paid | Tax Assessment Tax Assessment Total Assessment is a certain percentage of the fair market value that is determined by local assessors to be the total taxable value of land and additions on the property. | Land | Improvement |
|---|---|---|---|---|
| 2025 | $5,845 | $32,328 | $7,887 | $24,441 |
| 2024 | $5,857 | $30,499 | $6,993 | $23,506 |
| 2023 | $5,845 | $30,499 | $7,779 | $22,720 |
| 2022 | $5,756 | $49,260 | $12,120 | $37,140 |
| 2021 | $5,714 | $41,280 | $12,120 | $29,160 |
| 2020 | $5,406 | $42,420 | $12,120 | $30,300 |
| 2019 | $5,024 | $42,780 | $12,120 | $30,660 |
| 2018 | $4,883 | $25,416 | $7,984 | $17,432 |
| 2017 | $4,842 | $25,224 | $9,315 | $15,909 |
| 2016 | $4,447 | $25,224 | $9,315 | $15,909 |
| 2015 | $3,101 | $22,450 | $11,888 | $10,562 |
| 2014 | $3,101 | $21,180 | $13,440 | $7,740 |
Source: Public Records
Map
Nearby Homes
- 211-35 99th Ave
- 99-02 212 St
- 99-02 212th St
- 9904 212th St
- 99-11 213th St Unit 1
- 9911 213th St
- 99-23 215th St
- 91-03 212th St
- 213-19 102nd Ave
- 9022 Hollis Court Blvd
- 21727 Hempstead Ave
- 10219 213th St
- 10218 216th St
- 10221 213th St
- 91-19 215th Place
- 217-27 99th Ave
- 93-22 217th St
- 100-24 210th St
- 102-05 217th St
- 90-54 209th St
- 212-30 94th Ave
- 21230 94th Ave
- 212-61 212 Place
- 9407 212th Place
- 94-07 212th Place
- 9404 212th Place
- 9411 212th Place
- 9349 212th Place
- 21242 94th Ave
- 21216 94th Ave
- 9417 212th Place
- 9417 212th Place Unit House
- 9414 213th St
- 9417 212th Place
- 9345 212th Place
- 9416 213th St
- 93-45 212th Place
- 21212 94th Ave
- 9412 212th Place
- 94-18 213th St