94-1195 Keahua Loop Waipahu, HI 96797
Estimated Value: $1,174,000 - $1,357,000
5
Beds
4
Baths
2,521
Sq Ft
$493/Sq Ft
Est. Value
About This Home
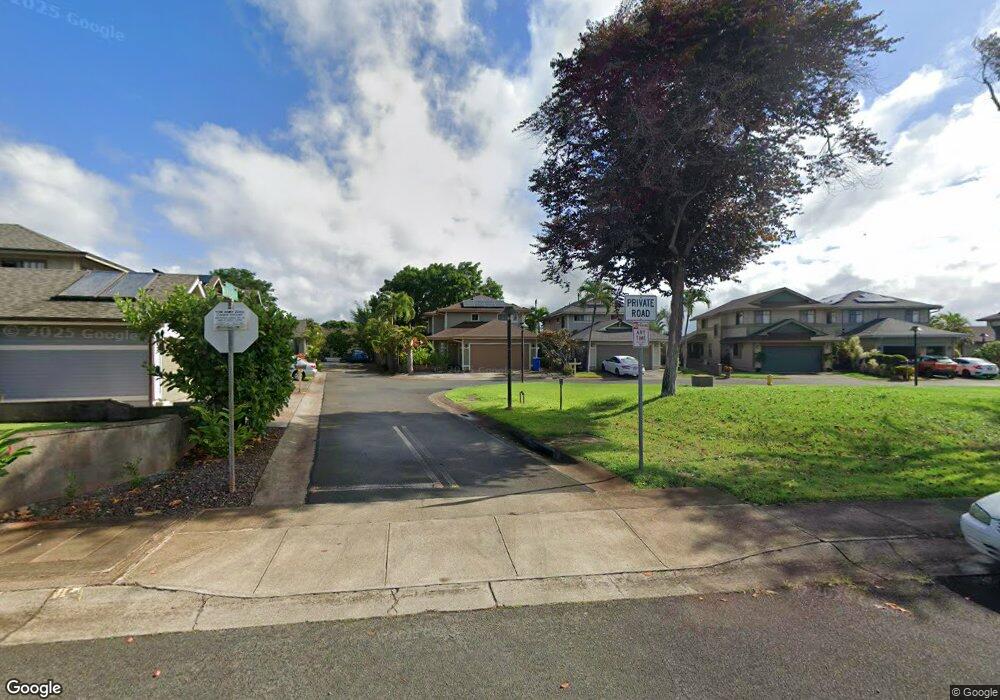
This home is located at 94-1195 Keahua Loop, Waipahu, HI 96797 and is currently estimated at $1,244,018, approximately $493 per square foot. 94-1195 Keahua Loop is a home located in Honolulu County with nearby schools including Kalei'opu'u Elementary School, Waipahu Intermediate School, and Waipahu High School.
Ownership History
Date
Name
Owned For
Owner Type
Purchase Details
Closed on
Apr 20, 2021
Sold by
Bayles Britt Clark and Fukutomi-Bayles Betty Ann
Bought by
Britt C Bayles And Betty A Fukutomi-Bayles Li and Bayles
Current Estimated Value
Purchase Details
Closed on
Sep 7, 2004
Sold by
Cabo Joey Peralta and Guillen Edelwina Ugalino
Bought by
Bayles Britt Clark and Fukutomi Bayles Betty Ann
Home Financials for this Owner
Home Financials are based on the most recent Mortgage that was taken out on this home.
Original Mortgage
$449,600
Interest Rate
6.06%
Mortgage Type
Unknown
Create a Home Valuation Report for This Property
The Home Valuation Report is an in-depth analysis detailing your home's value as well as a comparison with similar homes in the area
Home Values in the Area
Average Home Value in this Area
Purchase History
| Date | Buyer | Sale Price | Title Company |
|---|---|---|---|
| Britt C Bayles And Betty A Fukutomi-Bayles Li | -- | None Listed On Document | |
| Bayles Britt C | -- | None Available | |
| Bayles Britt C | -- | None Available | |
| Bayles Britt C | -- | None Available | |
| Bayles Britt Clark | $565,000 | -- |
Source: Public Records
Mortgage History
| Date | Status | Borrower | Loan Amount |
|---|---|---|---|
| Previous Owner | Bayles Britt Clark | $449,600 |
Source: Public Records
Tax History Compared to Growth
Tax History
| Year | Tax Paid | Tax Assessment Tax Assessment Total Assessment is a certain percentage of the fair market value that is determined by local assessors to be the total taxable value of land and additions on the property. | Land | Improvement |
|---|---|---|---|---|
| 2025 | $3,447 | $1,158,000 | $715,700 | $442,300 |
| 2024 | $3,447 | $1,144,800 | $715,700 | $429,100 |
| 2023 | $3,425 | $1,218,600 | $770,600 | $448,000 |
| 2022 | $2,874 | $961,100 | $582,900 | $378,200 |
| 2021 | $2,307 | $799,100 | $474,200 | $324,900 |
| 2020 | $2,479 | $808,400 | $474,200 | $334,200 |
| 2019 | $2,598 | $822,400 | $474,200 | $348,200 |
| 2018 | $2,451 | $780,400 | $444,600 | $335,800 |
| 2017 | $2,388 | $762,300 | $395,200 | $367,100 |
| 2016 | $2,461 | $783,100 | $380,300 | $402,800 |
| 2015 | $2,325 | $744,300 | $345,800 | $398,500 |
| 2014 | -- | $676,700 | $306,300 | $370,400 |
Source: Public Records
Map
Nearby Homes
- 94-245 Kaiholena Place
- 94-204 Kaiholena Place
- 94-1029 Haleaina St
- 94-1211 Heahea St
- 94-1008 Makakoa Loop
- 94-508 Kupuohi St Unit 8103
- 94-508 Kupuohi St Unit 8204
- 94-536 Kupuohi St Unit 22101
- 94-815 Kaaka St
- 94-797 Nolupe St
- 94-944 Anoiki St Unit 7
- 94-527 Lumiaina St Unit E101
- 94-527 Lumiaina St Unit E202
- 94-1010 Maiau St Unit 144
- 94-644 Lumiaina St Unit BB203
- 94-608 Lumiaina St Unit S201
- 94-624 Lumiaina St Unit J101
- 94-199 Iokoo Place Unit 96
- 94-758 Kaiao St
- 94-801 Kaapuna Place
- 94-1199 Keahua Loop
- 94-1193 Keahua Loop
- 94-1201 Keahua Loop
- 94-1189 Keahua Loop
- 94-1203 Keahua Loop
- 94-1187 Keahua Loop
- 94-1205 Keahua Loop
- 94-1215 Keahua Loop
- 94-1211 Keahua Loop
- 94-1217 Keahua Loop
- 94-1183 Keahua Loop
- 94-1209 Keahua Loop
- 94-1181 Keahua Loop
- 94-1177 Keahua Loop
- 94-1175 Keahua Loop
- 94-1210 Keahua Loop
- 94-1188 Keahua Loop
- 94-1208 Keahua Loop
- 94-1180 Keahua Loop
- 94-1167 Kaloli Loop