94-1311 Waipahu St Waipahu, HI 96797
Estimated payment $7,313/month
Highlights
- Parking available for a boat
- Building Patio
- Fenced
- Wood Flooring
- Bathroom on Main Level
- Level Lot
About This Home
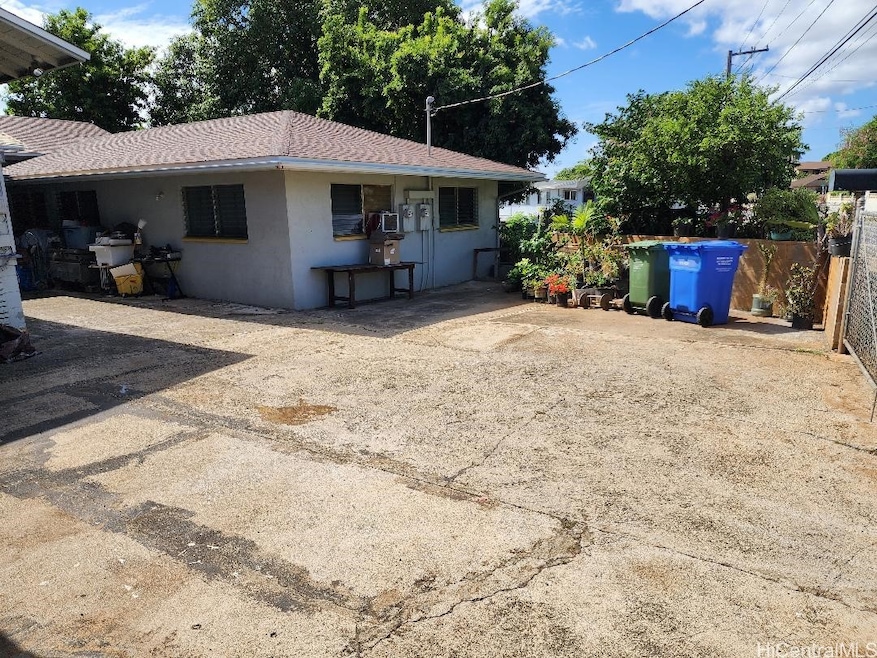
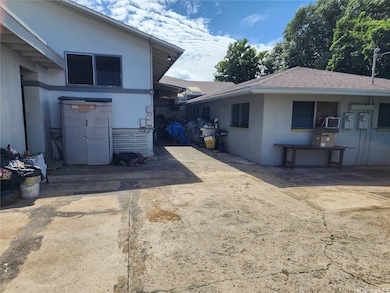
The possibilities are endless! This spacious 8-bedroom, 3-bath home sits on a generous 9,000+ sq ft lot, ideal for extended families or savvy investors. The roof was replaced in 2024. The home is in average condition awaiting your personal touch. The home has 2 separate dwellings with 2 separate entrances and 2 separate electrical meters. A 2-car carport plus an oversized driveway that could fit up to 6 more cars or room for a boat. Large covered lanai. There's a lot of potential in this property and will be conveyed AS IS. Number of bedrooms and bathrooms may differ from tax office records. Buyers please do your own diligence. Don’t miss your chance — schedule a showing today before it’s gone.
Listing Agent
CENTURY 21 Homefinders of HI Brokerage Phone: (808) 677-0721 License #RB-20167 Listed on: 11/04/2025

Home Details
Home Type
- Single Family
Est. Annual Taxes
- $5,940
Year Built
- Built in 1970
Lot Details
- 9,125 Sq Ft Lot
- Property fronts a county road
- Fenced
- Level Lot
- Zoning described as 05 - R-5 Residential District
Home Design
- Wood Frame Construction
- Composition Roof
Interior Spaces
- 2,702 Sq Ft Home
- 1-Story Property
Flooring
- Wood
- Laminate
- Ceramic Tile
Bedrooms and Bathrooms
- 8 Bedrooms
- Bathroom on Main Level
Parking
- 3 Parking Spaces
- Carport
- Driveway
- Parking available for a boat
Listing and Financial Details
- Assessor Parcel Number 1-9-4-040-012-0000
Community Details
Overview
- Association fees include common areas
- Waipahu Triangle Subdivision
Amenities
- Building Patio
- Community Deck or Porch
- Community Storage Space
Map
Home Values in the Area
Average Home Value in this Area
Tax History
| Year | Tax Paid | Tax Assessment Tax Assessment Total Assessment is a certain percentage of the fair market value that is determined by local assessors to be the total taxable value of land and additions on the property. | Land | Improvement |
|---|---|---|---|---|
| 2025 | $3,306 | $1,169,900 | $895,600 | $274,300 |
| 2024 | $3,306 | $1,104,500 | $895,600 | $208,900 |
| 2023 | $3,288 | $1,185,600 | $800,100 | $385,500 |
| 2022 | $3,288 | $1,079,400 | $692,600 | $386,800 |
| 2021 | $2,740 | $922,800 | $632,900 | $289,900 |
| 2020 | $2,828 | $947,900 | $585,200 | $362,700 |
| 2019 | $2,779 | $914,100 | $585,200 | $328,900 |
| 2018 | $2,544 | $846,800 | $525,400 | $321,400 |
| 2017 | $2,435 | $815,800 | $465,700 | $350,100 |
| 2016 | $2,221 | $754,600 | $423,900 | $330,700 |
| 2015 | $2,099 | $719,600 | $423,900 | $295,700 |
| 2014 | -- | $706,100 | $388,100 | $318,000 |
Property History
| Date | Event | Price | List to Sale | Price per Sq Ft |
|---|---|---|---|---|
| 11/05/2025 11/05/25 | Price Changed | $1,300,000 | +23.9% | $481 / Sq Ft |
| 11/04/2025 11/04/25 | For Sale | $1,049,000 | -- | $388 / Sq Ft |
Purchase History
| Date | Type | Sale Price | Title Company |
|---|---|---|---|
| Interfamily Deed Transfer | -- | None Available | |
| Warranty Deed | $555,000 | Itc | |
| Interfamily Deed Transfer | -- | -- |
Mortgage History
| Date | Status | Loan Amount | Loan Type |
|---|---|---|---|
| Open | $405,000 | Unknown | |
| Previous Owner | $321,500 | No Value Available |
Source: HiCentral MLS (Honolulu Board of REALTORS®)
MLS Number: 202524733
APN: 1-9-4-040-012-0000
Disclaimer: Certain information contained herein is derived from information provided by parties other than Homes.com. All information provided is deemed reliable, but is not guaranteed to be accurate and should be independently verified.
![]() Some of the active listings appearing on this site may be listed by other REALTORS(R). If you are interested in those active listings, our company may represent you as the buyer's agent. If the active listing you are interested in is our company's active listing, you may speak to one of our agents regarding your options for representation.
Some of the active listings appearing on this site may be listed by other REALTORS(R). If you are interested in those active listings, our company may represent you as the buyer's agent. If the active listing you are interested in is our company's active listing, you may speak to one of our agents regarding your options for representation.
Based on information from the Multiple Listing Service of HiCentral MLS, Ltd. Information is deemed reliable but not guaranteed. Copyright 2025 HiCentral MLS, Ltd
- 94-547 Hiahia Loop
- 94-365 Kahuapaa Place
- 94-350 Kahuapaa Place
- 94-341 Kahuanani St
- 94-341 Peke Ln
- 94-287 Kahuawai St
- 94-442 Kahualena Place
- 94-563 Laenui St
- 94-979 Kauolu Place Unit 610
- 94-302 Paiwa St Unit 1013
- 94-302 Paiwa St Unit 707
- 94-302 Paiwa St Unit 507
- 94-302 Paiwa St Unit 202
- 94-962 Kahuailani St
- 94-120 Poailani Cir
- 94-1037 Awalai St
- 94-203 Lumiaina Place Unit F201
- 94-201 Lumiaina Place Unit E202
- 94-941 Awanei St
- 94-870 Lumiauau St Unit Z204
- 94-406 Kahualei Place
- 94-302 Paiwa St Unit 1005
- 94-331-331 Kahualena St Unit 3
- 94-331-331 Kahualena St Unit Main
- 94-1098 Nawele St
- 94-970 Lumiauau St Unit G101
- 94-209 Lumiaina Place Unit J203
- 94-870 Lumiauau St Unit M206
- 94-819 Farrington Hwy Unit B4
- 94-133 Pahu St Unit A
- 94-510 Lumiaina St Unit M202
- 94-510 Lumiaina St Unit F202
- 94-1027 Halekapio St
- 94-531 Lumiauau St
- 94-550 Lumiauau St Unit J204
- 94-1265 Lumikula St Unit 1
- 1060 Kamehameha Hwy Unit 2002A
- 1060 Kamehameha Hwy Unit A-2306
- 1060 Kamehameha Hwy Unit 3601A
- 1060 Kamehameha Hwy Unit 3306B