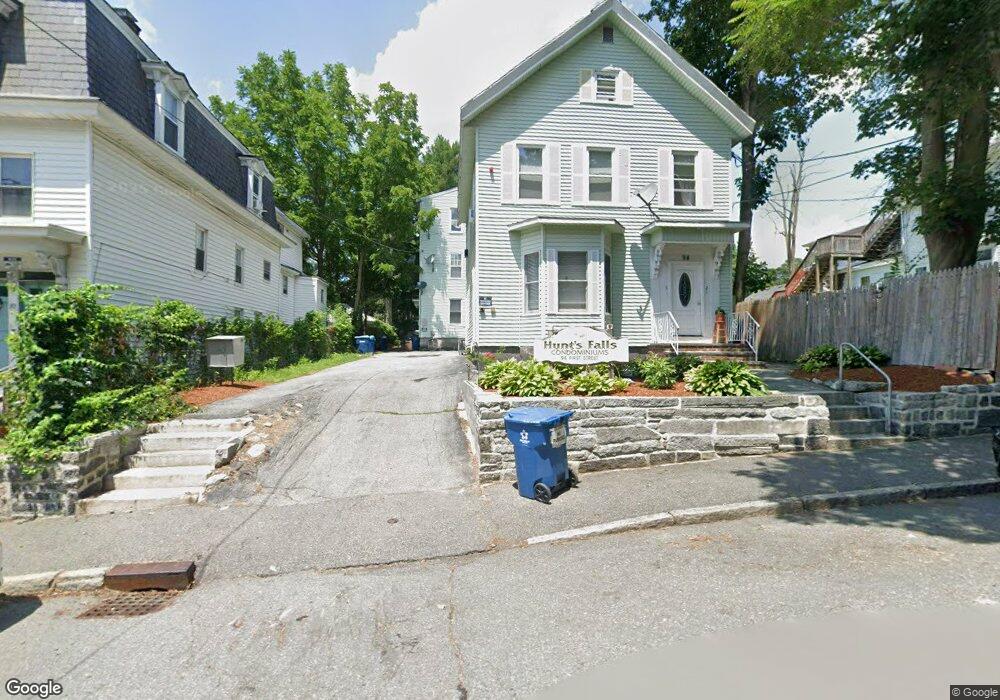
94 1st St Unit 7 Lowell, MA 01850
Centralville NeighborhoodEstimated Value: $155,000 - $200,000
2
Beds
1
Bath
564
Sq Ft
$327/Sq Ft
Est. Value
About This Home
This home is located at 94 1st St Unit 7, Lowell, MA 01850 and is currently estimated at $184,157, approximately $326 per square foot. 94 1st St Unit 7 is a home located in Middlesex County with nearby schools including Greenhalge Elementary School, S. Christa McAuliffe Elementary School, and Moody Elementary School.
Ownership History
Date
Name
Owned For
Owner Type
Purchase Details
Closed on
Oct 18, 2017
Sold by
Brewin Patricia B Est
Bought by
Latsios Zacharias
Current Estimated Value
Purchase Details
Closed on
Nov 23, 2009
Sold by
Perrin Kristin R
Bought by
Brewin Patricia B
Purchase Details
Closed on
May 31, 2006
Sold by
Duchesne Beatrice
Bought by
Perrin Kristin R
Home Financials for this Owner
Home Financials are based on the most recent Mortgage that was taken out on this home.
Original Mortgage
$72,500
Interest Rate
6.55%
Mortgage Type
Purchase Money Mortgage
Purchase Details
Closed on
May 11, 2004
Sold by
Bhardwaj Poonam and Bhardwaj Surinder
Bought by
Duchesne Beatrice
Purchase Details
Closed on
May 28, 1998
Sold by
Dimario Jeffrey T
Bought by
Bhardwaj Surinder
Purchase Details
Closed on
Feb 24, 1995
Sold by
Fgb Rlty Advisors Inc
Bought by
Dimario Jeffrey
Purchase Details
Closed on
Dec 2, 1994
Sold by
Savini Joseph and Fgb Realty Advisors
Bought by
Fgb Rlty Advisors
Create a Home Valuation Report for This Property
The Home Valuation Report is an in-depth analysis detailing your home's value as well as a comparison with similar homes in the area
Home Values in the Area
Average Home Value in this Area
Purchase History
| Date | Buyer | Sale Price | Title Company |
|---|---|---|---|
| Latsios Zacharias | $65,000 | -- | |
| Brewin Patricia B | $40,100 | -- | |
| Perrin Kristin R | $72,500 | -- | |
| Duchesne Beatrice | $43,000 | -- | |
| Bhardwaj Surinder | $20,000 | -- | |
| Dimario Jeffrey | $10,200 | -- | |
| Fgb Rlty Advisors | $19,800 | -- |
Source: Public Records
Mortgage History
| Date | Status | Borrower | Loan Amount |
|---|---|---|---|
| Previous Owner | Perrin Kristin R | $72,500 |
Source: Public Records
Tax History Compared to Growth
Tax History
| Year | Tax Paid | Tax Assessment Tax Assessment Total Assessment is a certain percentage of the fair market value that is determined by local assessors to be the total taxable value of land and additions on the property. | Land | Improvement |
|---|---|---|---|---|
| 2025 | $1,506 | $131,200 | $0 | $131,200 |
| 2024 | $1,417 | $119,000 | $0 | $119,000 |
| 2023 | $1,304 | $105,000 | $0 | $105,000 |
| 2022 | $1,159 | $91,300 | $0 | $91,300 |
| 2021 | $1,098 | $81,600 | $0 | $81,600 |
| 2020 | $1,297 | $97,100 | $0 | $97,100 |
| 2019 | $1,029 | $73,300 | $0 | $73,300 |
| 2018 | $920 | $63,900 | $0 | $63,900 |
| 2017 | $898 | $60,200 | $0 | $60,200 |
| 2016 | $797 | $52,600 | $0 | $52,600 |
| 2015 | $765 | $49,400 | $0 | $49,400 |
| 2013 | $896 | $59,700 | $0 | $59,700 |
Source: Public Records
Map
Nearby Homes
- 94 1st St Unit 10
- 8 Read St
- 27 4th St
- 12 Fremont St
- 192 1st St
- 57 Lakeview Ave
- 45 W 4th St
- 21 Vernon St
- 76 W 3rd St
- 11 Hampshire St
- 35 W 9th St
- 49 Coburn St
- 139 Beech St
- 130 John St Unit G01
- 130 John St Unit 242
- 130 John St Unit 455
- 284 Beacon St
- 41 W L St
- 17 Kearney Square Unit 201
- 17 Kearney Square Unit 205
- 94 1st St Unit 107
- 94 1st St Unit 11
- 94 1st St Unit 9
- 94 1st St Unit 6
- 94 1st St Unit 5
- 94 1st St Unit 3
- 94 1st St Unit 1
- 94 1st St Unit 8
- 94 1st St Unit 4
- 94 1st St Unit 2
- 94 1st St Unit 94 first st. Lowell
- 94 1st St
- 88 1st St
- 102 1st St
- 82 1st St
- 82 1st St
- 23 Read St
- 25 Read St
- 25 Read St Unit Third Floor
- 25 Read St Unit 1st Floor