
Landlord's Agent in 2024
Mary Jo Carranceja
Charles Rutenberg Realty Inc
(347) 544-3688
21 Total Sales
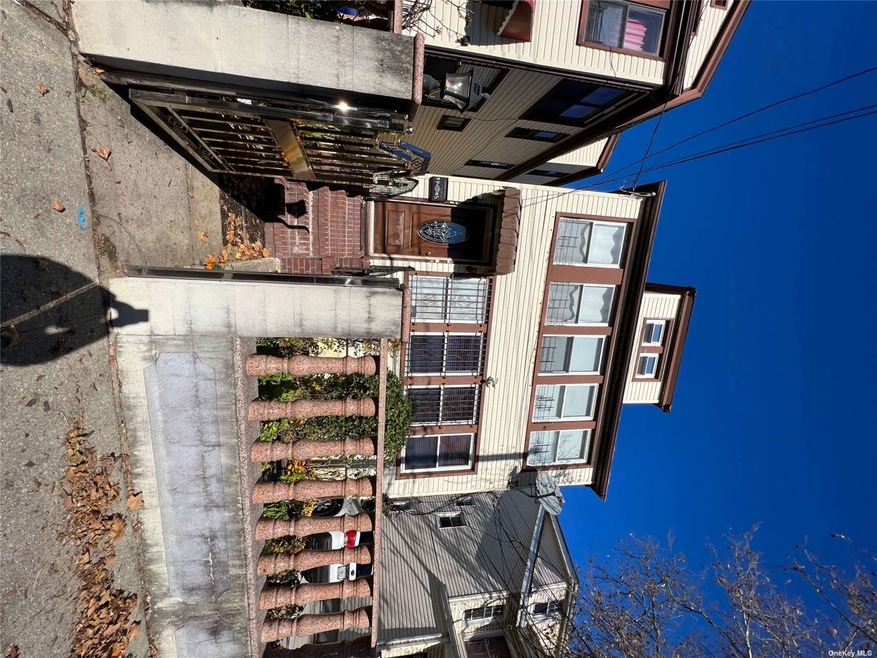
Don't miss this opportunity. Easy access to transportation, shopping and restaurants
Last Agent to Rent the Property
Charles Rutenberg Realty Inc Brokerage Phone: 347-544-3688 License #40CA1156965 Listed on: 11/28/2023
Last Renter's Agent
Charles Rutenberg Realty Inc Brokerage Phone: 347-544-3688 License #40CA1156965 Listed on: 11/28/2023
| Date | Event | Price | List to Sale | Price per Sq Ft |
|---|---|---|---|---|
| 02/07/2024 02/07/24 | Rented | $1,900 | -13.6% | -- |
| 11/28/2023 11/28/23 | For Rent | $2,200 | -- | -- |
| Year | Tax Paid | Tax Assessment Tax Assessment Total Assessment is a certain percentage of the fair market value that is determined by local assessors to be the total taxable value of land and additions on the property. | Land | Improvement |
|---|---|---|---|---|
| 2025 | $13,006 | $112,355 | $64,285 | $48,070 |
| 2024 | $13,006 | $104,033 | $71,404 | $32,629 |
| 2023 | $12,043 | $96,327 | $67,913 | $28,414 |
| 2022 | $10,913 | $179,100 | $151,650 | $27,450 |
| 2021 | $10,942 | $210,600 | $151,650 | $58,950 |
| 2020 | $10,780 | $231,750 | $151,650 | $80,100 |
| 2019 | $10,093 | $223,200 | $151,650 | $71,550 |
| 2018 | $9,425 | $74,098 | $53,357 | $20,741 |
| 2017 | $8,727 | $68,614 | $52,552 | $16,062 |
| 2016 | $8,541 | $68,614 | $52,552 | $16,062 |
| 2015 | $5,099 | $66,482 | $53,217 | $13,265 |
| 2014 | $5,099 | $61,558 | $53,883 | $7,675 |
Landlord's Agent in 2024
Mary Jo Carranceja
Charles Rutenberg Realty Inc
(347) 544-3688
21 Total Sales
Source: OneKey® MLS
MLS Number: KEY3518567
APN: 630100-01893-0025
Disclaimer: Certain information contained herein is derived from information provided by parties other than Homes.com. All information provided is deemed reliable, but is not guaranteed to be accurate and should be independently verified.
![]() The data relating to real estate for sale or lease on this web site comes in part from OneKey® MLS. Real estate listings held by brokerage firms other than Ten-X are marked with the OneKey® MLS logo or an abbreviated logo and detailed information about them includes the name of the listing broker.
The data relating to real estate for sale or lease on this web site comes in part from OneKey® MLS. Real estate listings held by brokerage firms other than Ten-X are marked with the OneKey® MLS logo or an abbreviated logo and detailed information about them includes the name of the listing broker.
Based on information submitted to the MLS GRID. All data is obtained from various sources and may not have been verified by broker or MLS GRID. Supplied Open House Information is subject to change without notice. All information should be independently reviewed and verified for accuracy. Properties may or may not be listed by the office/agent presenting the information. Some IDX listings have been excluded from this website. IDX information is provided exclusively for personal, non-commercial use, and may not be used for any purpose other than to identify prospective properties consumers may be interested in purchasing.
Information is deemed reliable but not guaranteed.
Copyright 2026 OneKey® MLS. All rights reserved.
Based on information submitted to the MLS GRID
Ask me questions while you tour the home.