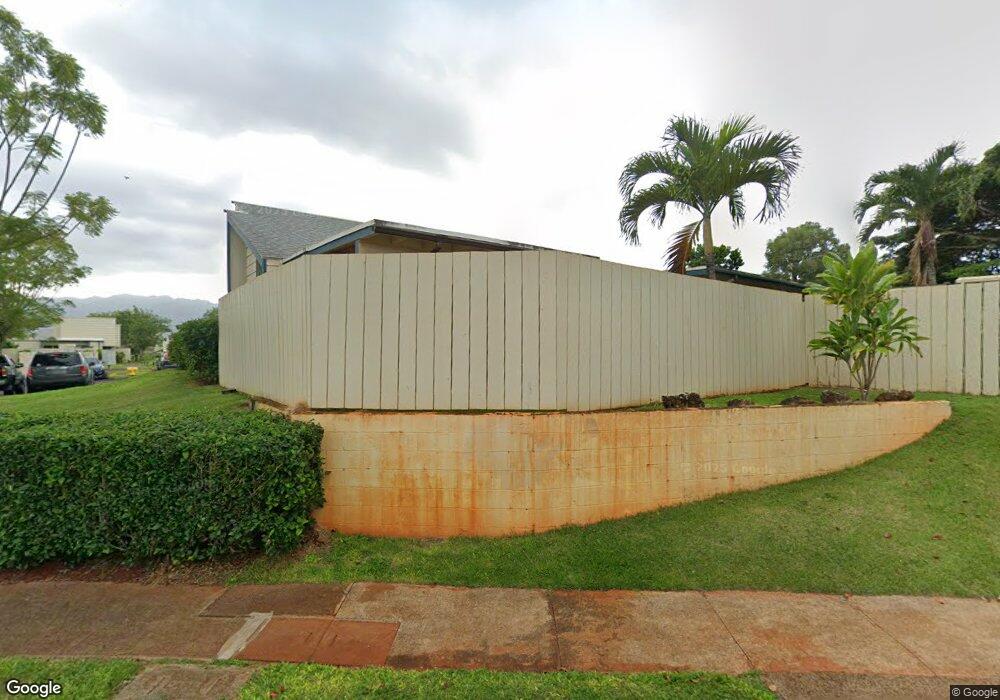
94-275 Makapipipi St Mililani, HI 96789
Estimated Value: $474,000 - $582,000
2
Beds
1
Bath
760
Sq Ft
$715/Sq Ft
Est. Value
About This Home
This home is located at 94-275 Makapipipi St, Mililani, HI 96789 and is currently estimated at $543,539, approximately $715 per square foot. 94-275 Makapipipi St is a home located in Honolulu County with nearby schools including Mililani Uka Elementary School, Mililani Middle School, and Mililani High School.
Ownership History
Date
Name
Owned For
Owner Type
Purchase Details
Closed on
May 27, 2003
Sold by
Kealoha Reginald George and Carino Nancy Trina
Bought by
Hurling Stephen M and Hurling Chikako
Current Estimated Value
Home Financials for this Owner
Home Financials are based on the most recent Mortgage that was taken out on this home.
Original Mortgage
$149,400
Outstanding Balance
$65,302
Interest Rate
5.75%
Mortgage Type
Unknown
Estimated Equity
$478,237
Purchase Details
Closed on
Jun 13, 1994
Sold by
Baker Frances Leialoha Drew and Baker John Pupuhi
Bought by
Kealoha Reginald George and Carino Nancy Trina
Home Financials for this Owner
Home Financials are based on the most recent Mortgage that was taken out on this home.
Original Mortgage
$144,000
Interest Rate
4.87%
Create a Home Valuation Report for This Property
The Home Valuation Report is an in-depth analysis detailing your home's value as well as a comparison with similar homes in the area
Home Values in the Area
Average Home Value in this Area
Purchase History
| Date | Buyer | Sale Price | Title Company |
|---|---|---|---|
| Hurling Stephen M | $166,000 | Fidelity National Title Ins | |
| Kealoha Reginald George | $180,000 | -- |
Source: Public Records
Mortgage History
| Date | Status | Borrower | Loan Amount |
|---|---|---|---|
| Open | Hurling Stephen M | $149,400 | |
| Previous Owner | Kealoha Reginald George | $144,000 |
Source: Public Records
Tax History Compared to Growth
Tax History
| Year | Tax Paid | Tax Assessment Tax Assessment Total Assessment is a certain percentage of the fair market value that is determined by local assessors to be the total taxable value of land and additions on the property. | Land | Improvement |
|---|---|---|---|---|
| 2025 | $1,514 | $551,500 | $448,700 | $102,800 |
| 2024 | $1,514 | $552,700 | $418,800 | $133,900 |
| 2023 | $1,203 | $543,600 | $398,900 | $144,700 |
| 2022 | $1,338 | $482,200 | $359,000 | $123,200 |
| 2021 | $1,113 | $418,100 | $345,700 | $72,400 |
| 2020 | $1,469 | $419,700 | $345,700 | $74,000 |
| 2019 | $1,532 | $437,600 | $332,400 | $105,200 |
| 2018 | $1,311 | $374,500 | $259,300 | $115,200 |
| 2017 | $1,231 | $351,700 | $259,300 | $92,400 |
| 2016 | $1,200 | $342,900 | $249,300 | $93,600 |
| 2015 | $1,072 | $306,200 | $226,000 | $80,200 |
| 2014 | -- | $288,500 | $199,400 | $89,100 |
Source: Public Records
Map
Nearby Homes
- 94-264 Napeha Place
- 94-373 Leleaka St
- 94-559 Makohilani St Unit 1071
- 94-443 Keaoopua St Unit 115
- 94-539 Makohilani St Unit 1036
- 94-523 Makohilani St Unit 1013
- 94-412 Keaoopua St Unit 51
- 94-234 Hikiku Place Unit 234
- 94-723 Meheula Pkwy Unit 3C
- 94-655 Ialeleiaka Place
- 94-325 Hokuahiahi St Unit 331
- 94-325 Hokuahiahi St Unit 329
- 94-348 Hokuala St Unit 118
- 94-100 Keahilele St
- 94-364 Kapuahi St Unit 58
- 94-389 Kaholo St Unit 83
- 94-84 Keahilele St
- 94-354 Keaolani St
- 94-557 Alapoai St Unit 154
- 94-555 Alapoai St Unit 152
- 94-275 Makapipipi St
- 94-275 Makapipipi St
- 94-275 Makapipipi St Unit 126
- 94-275 Makapipipi St Unit 128
- 94275 Makapipipi St Unit 125
- 94-273 Makapipipi St
- 94-273 Makapipipi St
- 94-273 Makapipipi St Unit 132
- 94-273 Makapipipi St
- 94-273 Makapipipi St Unit 129
- 94-277 Makapipipi St
- 94-277 Makapipipi St
- 94-277 Makapipipi St
- 94-277 Makapipipi St
- 94-277 Makapipipi St Unit 122
- 94-277 Makapipipi St Unit 121
- 94-271 Makapipipi St
- 94-271 Makapipipi St Unit 135
- 94-271 Makapipipi St Unit 134
- 94279 Makapipipi St Unit 120