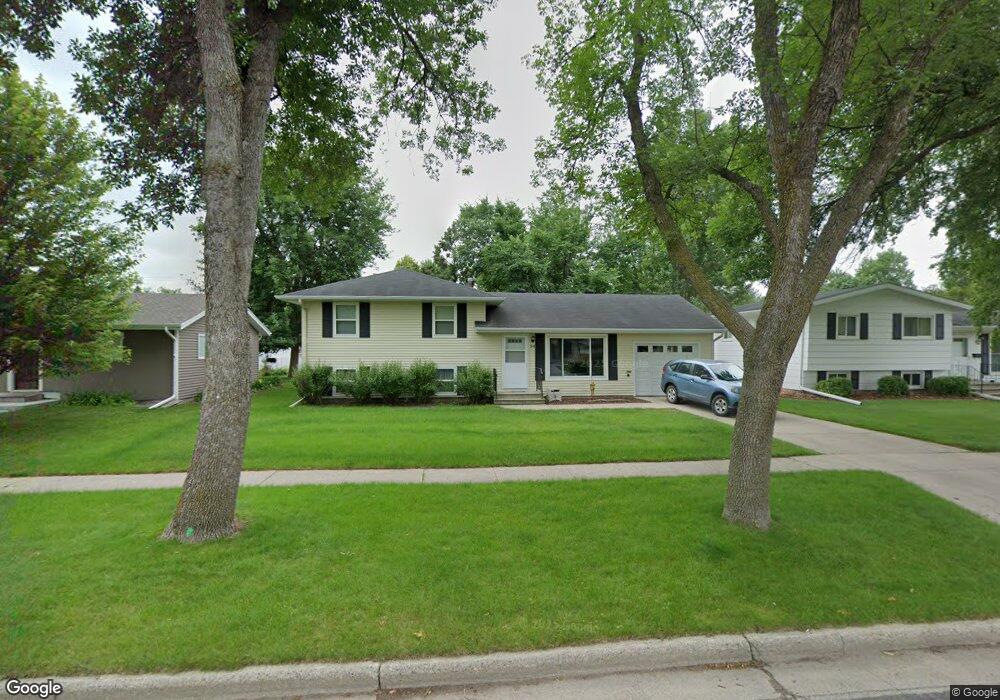
94 28th Ave N Fargo, ND 58102
Northport NeighborhoodEstimated Value: $288,000 - $319,160
4
Beds
2
Baths
1,920
Sq Ft
$156/Sq Ft
Est. Value
About This Home
This home is located at 94 28th Ave N, Fargo, ND 58102 and is currently estimated at $300,040, approximately $156 per square foot. 94 28th Ave N is a home located in Cass County with nearby schools including Longfellow Elementary School, Ben Franklin Middle School, and North High School.
Ownership History
Date
Name
Owned For
Owner Type
Purchase Details
Closed on
Oct 4, 2019
Sold by
Calabrese Beth and Dubs Viola A
Bought by
Hanten Blake L and Hanten Jennifer M
Current Estimated Value
Home Financials for this Owner
Home Financials are based on the most recent Mortgage that was taken out on this home.
Original Mortgage
$191,468
Outstanding Balance
$169,247
Interest Rate
3.95%
Mortgage Type
FHA
Estimated Equity
$130,793
Create a Home Valuation Report for This Property
The Home Valuation Report is an in-depth analysis detailing your home's value as well as a comparison with similar homes in the area
Home Values in the Area
Average Home Value in this Area
Purchase History
| Date | Buyer | Sale Price | Title Company |
|---|---|---|---|
| Hanten Blake L | $195,000 | Fm Title |
Source: Public Records
Mortgage History
| Date | Status | Borrower | Loan Amount |
|---|---|---|---|
| Open | Hanten Blake L | $191,468 |
Source: Public Records
Tax History Compared to Growth
Tax History
| Year | Tax Paid | Tax Assessment Tax Assessment Total Assessment is a certain percentage of the fair market value that is determined by local assessors to be the total taxable value of land and additions on the property. | Land | Improvement |
|---|---|---|---|---|
| 2024 | $3,361 | $133,550 | $28,000 | $105,550 |
| 2023 | $3,640 | $126,000 | $28,000 | $98,000 |
| 2022 | $3,145 | $112,500 | $28,000 | $84,500 |
| 2021 | $2,811 | $102,250 | $28,000 | $74,250 |
| 2020 | $2,599 | $95,550 | $28,000 | $67,550 |
| 2019 | $2,602 | $95,550 | $15,550 | $80,000 |
| 2018 | $2,144 | $82,550 | $15,550 | $67,000 |
| 2017 | $2,060 | $80,150 | $15,550 | $64,600 |
| 2016 | $1,765 | $74,900 | $15,550 | $59,350 |
| 2015 | $1,883 | $74,900 | $11,650 | $63,250 |
| 2014 | $1,980 | $76,800 | $11,650 | $65,150 |
| 2013 | $1,887 | $73,150 | $11,650 | $61,500 |
Source: Public Records
Map
Nearby Homes
- 87 28th Ave N
- 101 27th Ave N
- 2510 Evergreen Rd N
- 2512 2nd St N
- 2807 Edgewood Dr N
- 2902 3rd St N
- 310 27th Ave N
- 207 23rd Ave N
- 2925 Edgewood Dr N
- 2926 Edgewood Dr N
- 2937 Edgewood Dr N
- 418 25th Ave N
- 501 Forest Ave N Unit C
- 108 32nd Ave N
- 2939 Maple St N
- 111 19th Ave N
- 305 19th Ave N
- 3217 Cherry Ln N
- 3306 2nd St N Unit D26
- 1822 3rd St N