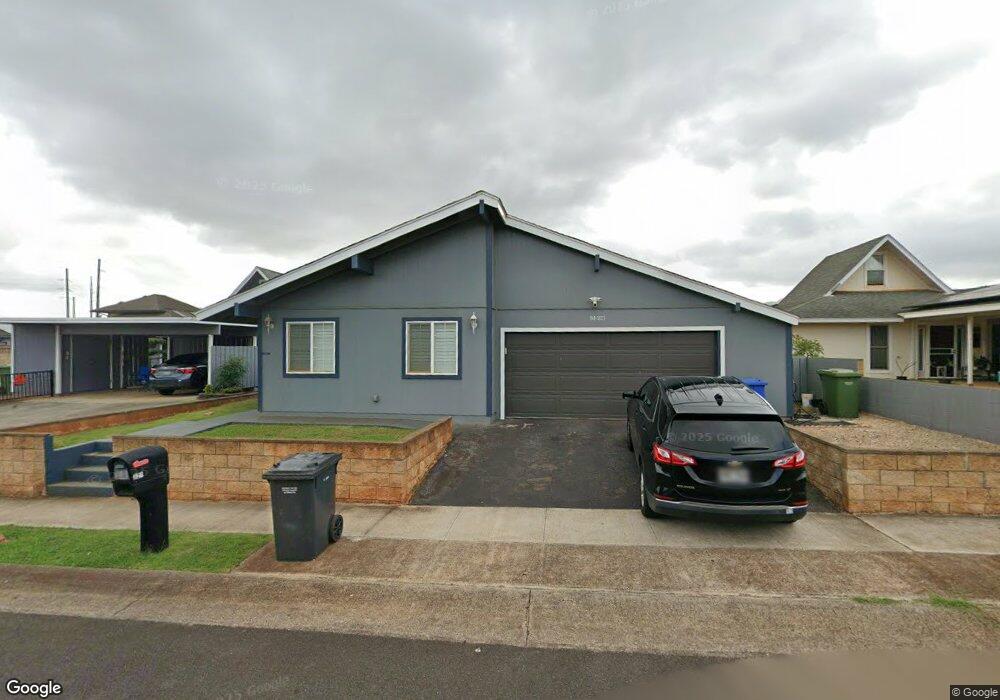
94-323 Makapipipi St Mililani, HI 96789
Estimated Value: $892,000 - $1,096,000
3
Beds
2
Baths
1,501
Sq Ft
$670/Sq Ft
Est. Value
About This Home
This home is located at 94-323 Makapipipi St, Mililani, HI 96789 and is currently estimated at $1,005,728, approximately $670 per square foot. 94-323 Makapipipi St is a home located in Honolulu County with nearby schools including Mililani Uka Elementary School, Mililani Middle School, and Mililani High School.
Ownership History
Date
Name
Owned For
Owner Type
Purchase Details
Closed on
Aug 19, 2020
Sold by
Foster Paul Kelala and Foster Chantel Denise
Bought by
Foster Paul K and Foster Chantel D
Current Estimated Value
Home Financials for this Owner
Home Financials are based on the most recent Mortgage that was taken out on this home.
Original Mortgage
$237,000
Outstanding Balance
$209,844
Interest Rate
2.9%
Mortgage Type
New Conventional
Estimated Equity
$795,884
Purchase Details
Closed on
Aug 8, 2017
Sold by
Foster Paul Kelala and Foster Chantel Denise
Bought by
Foster Paul K and Foster Chantel D
Purchase Details
Closed on
Dec 21, 2001
Sold by
Hamada Charles Yoshikazu and Hamada Della Yoshino
Bought by
Foster Paul Kelala and Foster Chantel Denise
Home Financials for this Owner
Home Financials are based on the most recent Mortgage that was taken out on this home.
Original Mortgage
$211,500
Interest Rate
6.51%
Create a Home Valuation Report for This Property
The Home Valuation Report is an in-depth analysis detailing your home's value as well as a comparison with similar homes in the area
Home Values in the Area
Average Home Value in this Area
Purchase History
| Date | Buyer | Sale Price | Title Company |
|---|---|---|---|
| Foster Paul K | -- | Accommodation | |
| Foster Paul Kelala | -- | Tg | |
| Foster Paul K | -- | Accommodation | |
| Foster Paul Kelala | -- | Tg | |
| Foster Paul K | -- | None Available | |
| Foster Paul K | -- | None Available | |
| Foster Paul Kelala | $235,000 | -- |
Source: Public Records
Mortgage History
| Date | Status | Borrower | Loan Amount |
|---|---|---|---|
| Open | Foster Paul Kelala | $237,000 | |
| Closed | Foster Paul Kelala | $237,000 | |
| Closed | Foster Paul Kelala | $211,500 |
Source: Public Records
Tax History Compared to Growth
Tax History
| Year | Tax Paid | Tax Assessment Tax Assessment Total Assessment is a certain percentage of the fair market value that is determined by local assessors to be the total taxable value of land and additions on the property. | Land | Improvement |
|---|---|---|---|---|
| 2025 | $3,185 | $1,079,800 | $840,000 | $239,800 |
| 2024 | $3,185 | $1,030,100 | $840,000 | $190,100 |
| 2023 | $3,178 | $1,085,600 | $871,500 | $214,100 |
| 2022 | $3,178 | $1,008,000 | $735,000 | $273,000 |
| 2021 | $2,537 | $824,900 | $567,000 | $257,900 |
| 2020 | $2,367 | $776,200 | $588,000 | $188,200 |
| 2019 | $2,527 | $801,900 | $588,000 | $213,900 |
| 2018 | $2,346 | $750,200 | $504,000 | $246,200 |
| 2017 | $2,276 | $730,300 | $483,000 | $247,300 |
| 2016 | $2,176 | $701,600 | $483,000 | $218,600 |
| 2015 | $2,047 | $664,800 | $472,500 | $192,300 |
| 2014 | -- | $615,100 | $441,000 | $174,100 |
Source: Public Records
Map
Nearby Homes
- 94-264 Napeha Place
- 94-373 Leleaka St
- 94-523 Makohilani St Unit 1013
- 94-539 Makohilani St Unit 1036
- 94-443 Keaoopua St Unit 115
- 94-412 Keaoopua St Unit 51
- 94-234 Hikiku Place Unit 234
- 94-723 Meheula Pkwy Unit 3C
- 94-348 Hokuala St Unit 118
- 94-325 Hokuahiahi St Unit 331
- 94-325 Hokuahiahi St Unit 329
- 94-364 Kapuahi St Unit 58
- 94-389 Kaholo St Unit 83
- 94-1251 Hale Halawai Dr Unit 39
- 94-100 Keahilele St
- 94-84 Keahilele St
- 94-341 Ulukoa St
- 94-354 Keaolani St
- 94-557 Alapoai St Unit 154
- 94-555 Alapoai St Unit 152
- 94-327 Makapipipi St
- 94-319 Makapipipi St
- 94-440 Kealohi Place
- 94-444 Kealohi Place
- 94-315 Makapipipi St
- 94-331 Makapipipi St
- 94-448 Kealohi Place
- 94-436 Kealohi Place
- 94-324 Makapipipi St
- 94-328 Makapipipi St
- 94-432 Kealohi Place
- 94-316 Makapipipi St
- 94-311 Makapipipi St
- 94-428 Kealohi Place
- 94-450 Kealohi Place
- 94-335 Makapipipi St
- 94-338 Makapipipi St
- 94-312 Makapipipi St
- 94-451 Kealohi Place
- 94-446 Kapakapa Way