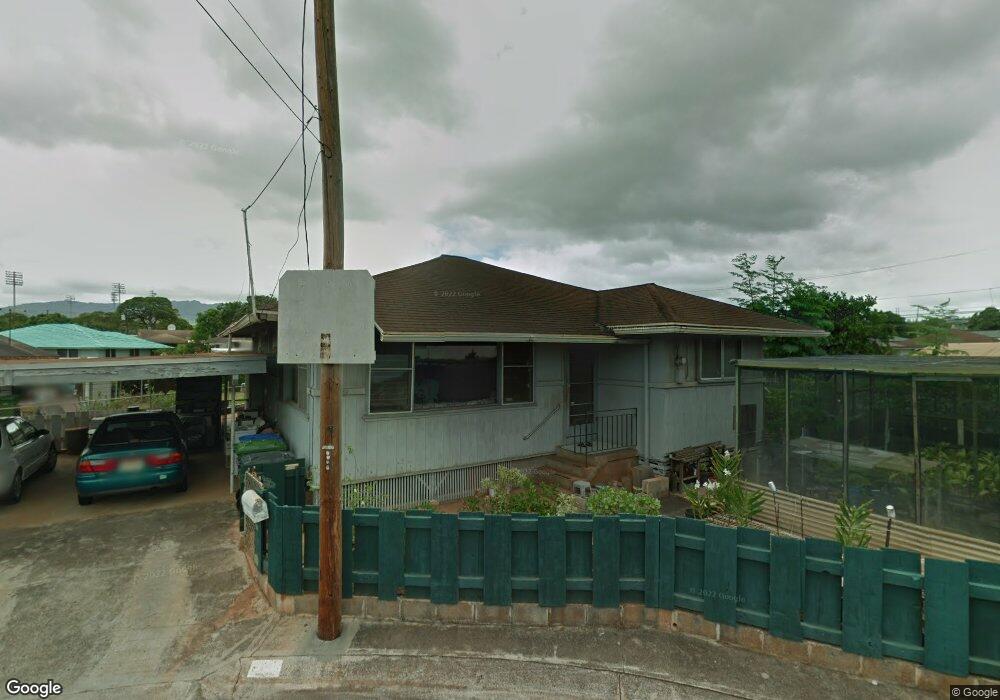
94-366 Nalii Place Waipahu, HI 96797
Estimated Value: $889,000 - $922,000
3
Beds
2
Baths
1,408
Sq Ft
$643/Sq Ft
Est. Value
About This Home
This home is located at 94-366 Nalii Place, Waipahu, HI 96797 and is currently estimated at $905,922, approximately $643 per square foot. 94-366 Nalii Place is a home located in Honolulu County with nearby schools including August Ahrens Elementary School, Waipahu Intermediate School, and Waipahu High School.
Ownership History
Date
Name
Owned For
Owner Type
Purchase Details
Closed on
Apr 16, 2023
Sold by
Takiguchi-Lee Jan Sadako Le
Bought by
Takiguchi Ritsuko
Current Estimated Value
Purchase Details
Closed on
Jan 6, 2022
Sold by
Sadako Takiguchi-Lee Jan
Bought by
Jan S Takiguchi-Lee Revocable Trust
Purchase Details
Closed on
Feb 3, 2021
Sold by
Teramoto Carrie Ann Keiko Nagamine and Teramoto Gle
Bought by
Carrie Ann K N Teramoto Revocable Trust and Teramoto
Purchase Details
Closed on
Nov 5, 2015
Sold by
Takiguchi Lee Jan Sadako and Takiguchi Ritsuko
Bought by
Takiguchi Lee Jan Sadako and Teramoto Carrie Ann Keiko Nagamine
Create a Home Valuation Report for This Property
The Home Valuation Report is an in-depth analysis detailing your home's value as well as a comparison with similar homes in the area
Home Values in the Area
Average Home Value in this Area
Purchase History
| Date | Buyer | Sale Price | Title Company |
|---|---|---|---|
| Takiguchi Ritsuko | -- | None Listed On Document | |
| Teramoto Carrie Ann Keiko Na | -- | None Listed On Document | |
| Takiguchi-Lee Jan Sadako | -- | None Listed On Document | |
| Jan S Takiguchi-Lee Revocable Trust | -- | Jennifer R Okubo Polido Lllc | |
| Jan S Takiguchi-Lee Revocable Trust | -- | Jennifer R Okubo Polido Lllc | |
| Carrie Ann K N Teramoto Revocable Trust | -- | None Listed On Document | |
| Teramoto Carrie Ann K N | -- | None Available | |
| Teramoto Carrie Ann K N | -- | None Available | |
| Takiguchi Lee Jan Sadako | -- | None Available | |
| Takiguchi Lee Jan Sadako | -- | None Available |
Source: Public Records
Tax History Compared to Growth
Tax History
| Year | Tax Paid | Tax Assessment Tax Assessment Total Assessment is a certain percentage of the fair market value that is determined by local assessors to be the total taxable value of land and additions on the property. | Land | Improvement |
|---|---|---|---|---|
| 2025 | $3,010 | $832,000 | $758,900 | $73,100 |
| 2024 | $3,010 | $860,100 | $748,800 | $111,300 |
| 2023 | $3,025 | $864,400 | $688,100 | $176,300 |
| 2022 | $2,662 | $760,700 | $586,900 | $173,800 |
| 2021 | $2,462 | $703,400 | $505,900 | $197,500 |
| 2020 | $2,301 | $657,300 | $485,700 | $171,600 |
| 2019 | $2,277 | $650,500 | $485,700 | $164,800 |
| 2018 | $1,979 | $565,300 | $445,200 | $120,100 |
| 2017 | $1,874 | $535,400 | $394,600 | $140,800 |
| 2016 | $1,416 | $524,700 | $344,000 | $180,700 |
| 2015 | $1,345 | $504,400 | $344,000 | $160,400 |
| 2014 | -- | $456,800 | $333,900 | $122,900 |
Source: Public Records
Map
Nearby Homes
- 94-302 Paiwa St Unit 707
- 94-302 Paiwa St Unit 507
- 94-302 Paiwa St Unit 202
- 94-341 Peke Ln
- 94-287 Kahuawai St
- 94-891 Waipahu St
- 94-341 Kahuanani St
- 94-350 Kahuapaa Place
- 94-941 Awanei St
- 94-1311 Waipahu St
- 94-815 Waipahu St
- 94-825 Waipahu St
- 94-470 Paiwa St Unit 2
- 94-1037 Awalai St
- 94-769 Haakoa Place
- 94-547 Hiahia Loop
- 94-832 Awanei St Unit B
- 94-571 Anaaina Place
- 94-403 Kahualei Place
- 94-1090 Kuhaulua St
- 94-371 Niau St
- 94-340 Paiwa St
- 94-358 Nalii Place
- 94-336 Paiwa St
- 94-344 Paiwa St
- 94-359 Nalii Place
- 94-373 Niau St
- 94-369 Niau St
- 94-357 Niau St
- 94-332 Paiwa St
- 94-348 Paiwa St Unit 7E
- 94-377 Niau St
- 94-350 Nalii Place
- 94-351 Nalii Place
- 94-361 Niau St
- 94-330 Paiwa St
- 94-355 Niau St
- 94-352 Paiwa St
- 94-383 Niau St
- 94-1058 Nalii St