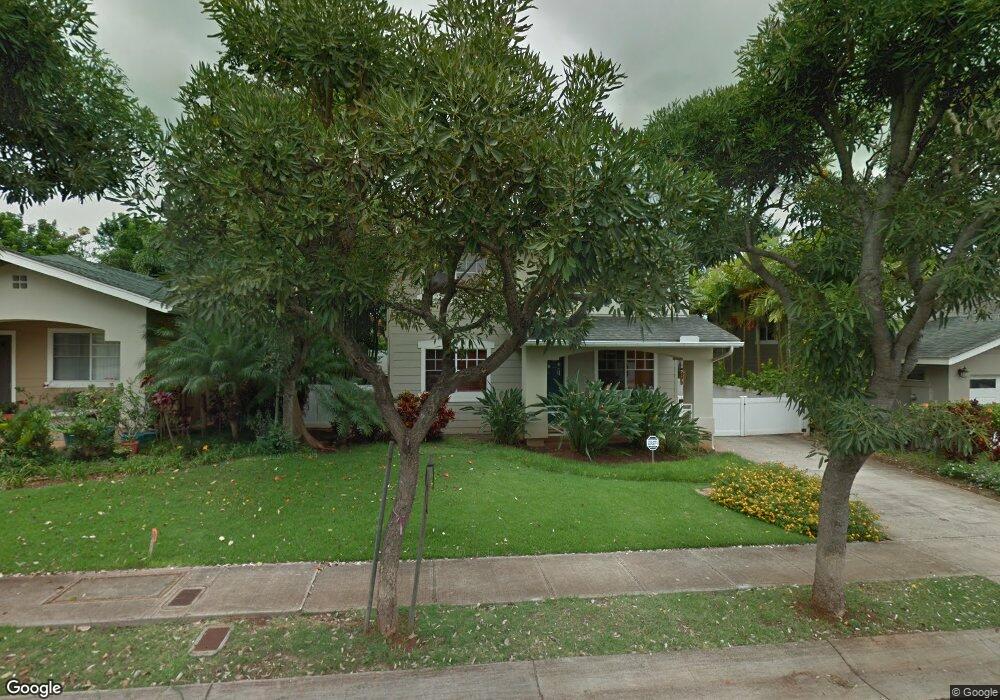
94-505 Kaikua Place Unit 2 Waipahu, HI 96797
Estimated Value: $1,053,216 - $1,134,000
3
Beds
3
Baths
1,613
Sq Ft
$682/Sq Ft
Est. Value
About This Home
This home is located at 94-505 Kaikua Place Unit 2, Waipahu, HI 96797 and is currently estimated at $1,100,304, approximately $682 per square foot. 94-505 Kaikua Place Unit 2 is a home located in Honolulu County with nearby schools including Waikele Elementary School, Waipahu Intermediate School, and Waipahu High School.
Ownership History
Date
Name
Owned For
Owner Type
Purchase Details
Closed on
Mar 14, 2011
Sold by
Gonzales Jose Molina and Gonzales Tiare Therese Geolina
Bought by
Garcia Mark Agag and Garcia Darlene Inis
Current Estimated Value
Home Financials for this Owner
Home Financials are based on the most recent Mortgage that was taken out on this home.
Original Mortgage
$460,000
Outstanding Balance
$315,768
Interest Rate
4.77%
Mortgage Type
New Conventional
Estimated Equity
$784,536
Purchase Details
Closed on
Feb 2, 2005
Sold by
Castle & Cooke Renaissance Llc
Bought by
Gonzales Jose Molina and Gonzales Tiare Therese Geolina
Home Financials for this Owner
Home Financials are based on the most recent Mortgage that was taken out on this home.
Original Mortgage
$398,400
Interest Rate
5.79%
Mortgage Type
New Conventional
Create a Home Valuation Report for This Property
The Home Valuation Report is an in-depth analysis detailing your home's value as well as a comparison with similar homes in the area
Home Values in the Area
Average Home Value in this Area
Purchase History
| Date | Buyer | Sale Price | Title Company |
|---|---|---|---|
| Garcia Mark Agag | $575,000 | Tg | |
| Gonzales Jose Molina | $498,000 | -- |
Source: Public Records
Mortgage History
| Date | Status | Borrower | Loan Amount |
|---|---|---|---|
| Open | Garcia Mark Agag | $460,000 | |
| Previous Owner | Gonzales Jose Molina | $398,400 | |
| Closed | Gonzales Jose Molina | $49,800 |
Source: Public Records
Tax History Compared to Growth
Tax History
| Year | Tax Paid | Tax Assessment Tax Assessment Total Assessment is a certain percentage of the fair market value that is determined by local assessors to be the total taxable value of land and additions on the property. | Land | Improvement |
|---|---|---|---|---|
| 2025 | $2,961 | $1,005,200 | $653,100 | $352,100 |
| 2024 | $2,961 | $965,900 | $613,500 | $352,400 |
| 2023 | $2,961 | $1,046,000 | $613,500 | $432,500 |
| 2022 | $2,836 | $910,400 | $514,600 | $395,800 |
| 2021 | $2,501 | $814,700 | $455,200 | $359,500 |
| 2020 | $2,364 | $775,300 | $455,200 | $320,100 |
| 2019 | $2,364 | $755,400 | $455,200 | $300,200 |
| 2018 | $2,233 | $718,100 | $415,600 | $302,500 |
| 2017 | $2,072 | $672,100 | $346,300 | $325,800 |
| 2016 | $2,003 | $652,300 | $336,500 | $315,800 |
| 2015 | $2,027 | $659,200 | $336,500 | $322,700 |
| 2014 | -- | $634,900 | $301,800 | $333,100 |
Source: Public Records
Map
Nearby Homes
- 94-1090 Kuhaulua St
- 94-571 Anaaina Place
- 94-816 Kuhaulua St
- 94-510 Lumiaina St Unit J202
- 94-510 Lumiaina St Unit N201
- 94-470 Paiwa St Unit 2
- 94-555 Awamoi St
- 94-519 Lumiaina St Unit J204
- 94-556 Koaleo St Unit B
- 94-536 Koaleo St Unit A
- 94-644 Lumiaina St Unit BB203
- 94-608 Lumiaina St Unit S201
- 94-624 Lumiaina St Unit J101
- 94-600 Lumiaina St Unit W202
- 94-815 Waipahu St
- 94-825 Waipahu St
- 94-891 Waipahu St
- 94-246 Aniani Place
- 94-944 Anoiki St Unit 7
- 94-249 Waikele Rd Unit B110
- 94-509 Kaikua Place Unit 3
- 94-501 Kaikua Place Unit 1
- 94-506 Kaikua Place Unit 11
- 94-510 Kaikua Place Unit 10
- 94-502 Kaikua Place Unit 12
- 94-896 Kumuao St
- 94-514 Kaikua Place Unit 9
- 94-900 Kumuao St
- 94-517 Kaikua Place Unit 5
- 94-867 Hiapo St
- 94-904 Kumuao St
- 94-521 Kaikua Place Unit 6
- 94-863 Hiapo St
- 94-522 Kaikua Place Unit 7
- 94-509 Halemoe Place Unit 15
- 94-505 Halemoe Place Unit 14
- 94-908 Kumuao St
- 94-501 Halemoe Place
- 94-513 Halemoe Place Unit 16
- 94-519 Kaikua Place