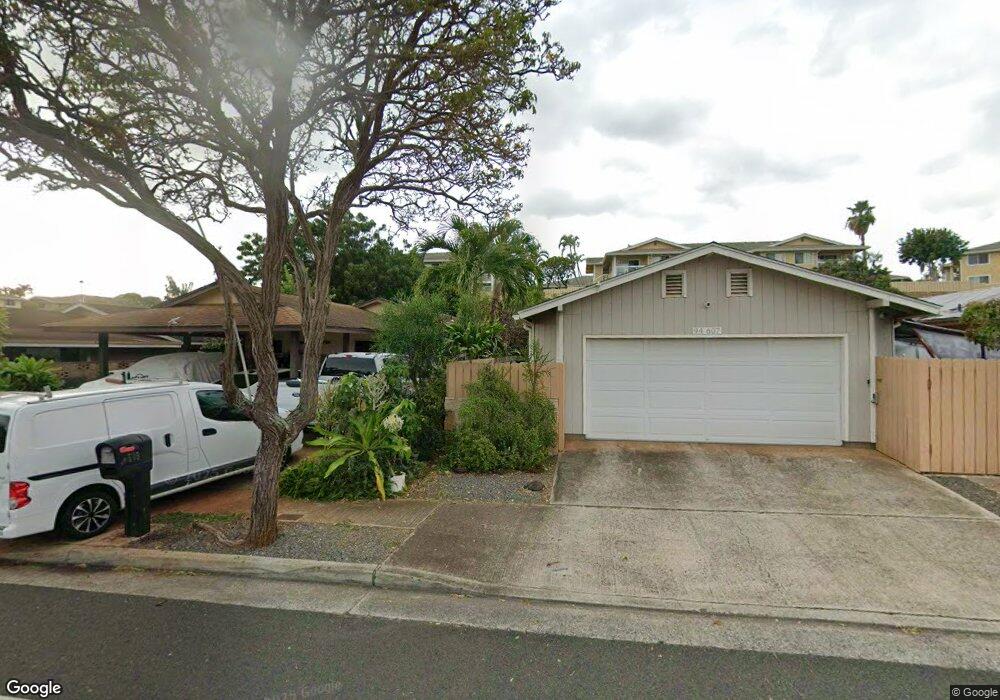
94-609 Kupuna Loop Waipahu, HI 96797
Estimated Value: $868,000 - $1,040,000
4
Beds
3
Baths
1,428
Sq Ft
$663/Sq Ft
Est. Value
About This Home
This home is located at 94-609 Kupuna Loop, Waipahu, HI 96797 and is currently estimated at $946,150, approximately $662 per square foot. 94-609 Kupuna Loop is a home located in Honolulu County with nearby schools including Kalei'opu'u Elementary School, Waipahu Intermediate School, and Waipahu High School.
Ownership History
Date
Name
Owned For
Owner Type
Purchase Details
Closed on
May 21, 2008
Sold by
Deperalta Jose A and Deperalta Jose Angeles
Bought by
Deperalta Jose Angeles and Jose Angeles Deperalta Revocable Living
Current Estimated Value
Purchase Details
Closed on
May 13, 2003
Sold by
Kaneshiro Dan E
Bought by
Deperalta Jose A
Purchase Details
Closed on
Mar 10, 1998
Sold by
Moore Robert Alphonso
Bought by
Pagan Cruz Jorge Joaquin and Pagan Cruz Melinda Kamakaokalani Midori
Home Financials for this Owner
Home Financials are based on the most recent Mortgage that was taken out on this home.
Original Mortgage
$198,000
Interest Rate
7.11%
Purchase Details
Closed on
Jul 23, 1996
Sold by
Moore Robert Alphonso and Moore Yuriko Matsudo
Bought by
Moore Robert Alphonso
Home Financials for this Owner
Home Financials are based on the most recent Mortgage that was taken out on this home.
Original Mortgage
$222,500
Interest Rate
8.39%
Create a Home Valuation Report for This Property
The Home Valuation Report is an in-depth analysis detailing your home's value as well as a comparison with similar homes in the area
Home Values in the Area
Average Home Value in this Area
Purchase History
| Date | Buyer | Sale Price | Title Company |
|---|---|---|---|
| Deperalta Jose Angeles | -- | None Available | |
| Deperalta Jose A | $175,000 | -- | |
| Pagan Cruz Jorge Joaquin | $190,000 | -- | |
| Moore Robert Alphonso | -- | -- |
Source: Public Records
Mortgage History
| Date | Status | Borrower | Loan Amount |
|---|---|---|---|
| Previous Owner | Pagan Cruz Jorge Joaquin | $198,000 | |
| Previous Owner | Moore Robert Alphonso | $222,500 |
Source: Public Records
Tax History Compared to Growth
Tax History
| Year | Tax Paid | Tax Assessment Tax Assessment Total Assessment is a certain percentage of the fair market value that is determined by local assessors to be the total taxable value of land and additions on the property. | Land | Improvement |
|---|---|---|---|---|
| 2025 | $2,388 | $880,700 | $647,400 | $233,300 |
| 2024 | $2,388 | $842,300 | $647,400 | $194,900 |
| 2023 | $2,364 | $915,400 | $725,900 | $189,500 |
| 2022 | $2,351 | $811,700 | $588,500 | $223,200 |
| 2021 | $1,859 | $671,000 | $480,600 | $190,400 |
| 2020 | $1,881 | $677,300 | $480,600 | $196,700 |
| 2019 | $1,943 | $675,000 | $480,600 | $194,400 |
| 2018 | $1,850 | $648,600 | $451,200 | $197,400 |
| 2017 | $1,713 | $609,300 | $382,600 | $226,700 |
| 2016 | $1,596 | $575,900 | $367,800 | $208,100 |
| 2015 | $1,477 | $541,900 | $328,600 | $213,300 |
| 2014 | -- | $516,400 | $304,100 | $212,300 |
Source: Public Records
Map
Nearby Homes
- 94-508 Kupuohi St Unit 8103
- 94-508 Kupuohi St Unit 8204
- 94-536 Kupuohi St Unit 22101
- 94-546 Kupuohi St Unit 104
- 94-502 Kupuohi St Unit 5201
- 94-510 Kupuohi St Unit 9201
- 94-113 Poloai Way Unit 10
- 94-1010 Awalua St
- 94-471 Palai St
- 94-1059 Pouhana Way Unit 3
- 94-737 Kime St
- 94-758 Kaiao St
- 94-165 Kupuohi Place
- 94-1008 Waiopae St
- 94-797 Nolupe St
- 94-805 Kaaholo St
- 94-078 Hulahe St
- 94-944 Anoiki St Unit 7
- 94-1106 Kaloli Loop
- 94-481 Honowai St
- 94-613 Kupuna Loop
- 94-607 Kupuna Loop
- 94-615 Kupuna Loop
- 94-605 Kupuna Loop
- 94-601 Kupuna Loop
- 94-617 Kupuna Loop
- 94-609 Minoaka Place
- 94-610 Minoaka Place
- 94-599 Kupuna Loop
- 94-621 Kupuna Loop
- 94-623 Kupuna Loop
- 94-606 Minoaka Place
- 94-605 Minoaka Place
- 94-598 Kupuna Loop Unit 605
- 94-593 Kupuna Loop
- 94-625 Kupuna Loop
- 94-601 Minoaka Place
- 94-602 Minoaka Place
- 94-596 Kupuna Loop
- 94-591 Kupuna Loop