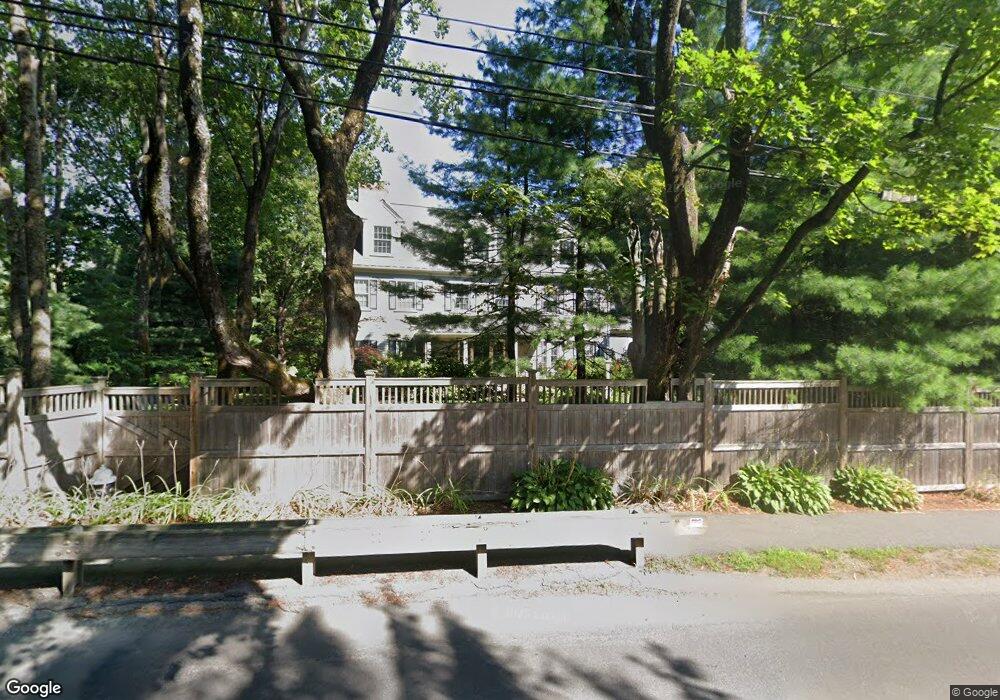
94 Adams St Lexington, MA 02420
North Lexington NeighborhoodEstimated Value: $2,544,000 - $2,844,000
5
Beds
5
Baths
4,659
Sq Ft
$569/Sq Ft
Est. Value
About This Home
This home is located at 94 Adams St, Lexington, MA 02420 and is currently estimated at $2,651,382, approximately $569 per square foot. 94 Adams St is a home located in Middlesex County with nearby schools including Fiske Elementary School, William Diamond Middle School, and Lexington High School.
Ownership History
Date
Name
Owned For
Owner Type
Purchase Details
Closed on
Aug 20, 2003
Sold by
Bose Partha and Bose Vinita
Bought by
Bose Rt and Trs
Current Estimated Value
Purchase Details
Closed on
Feb 20, 1998
Sold by
Winnetucket Rt
Bought by
Vonrickenbach Josef and Vonrickenbach Therese
Purchase Details
Closed on
Oct 5, 1995
Sold by
Lingane Beatrice M
Bought by
Winnetucket Rt and Perry
Create a Home Valuation Report for This Property
The Home Valuation Report is an in-depth analysis detailing your home's value as well as a comparison with similar homes in the area
Home Values in the Area
Average Home Value in this Area
Purchase History
| Date | Buyer | Sale Price | Title Company |
|---|---|---|---|
| Bose Rt | -- | -- | |
| Bose Rt | -- | -- | |
| Vonrickenbach Josef | $325,000 | -- | |
| Vonrickenbach Josef | $325,000 | -- | |
| Winnetucket Rt | $450,000 | -- |
Source: Public Records
Mortgage History
| Date | Status | Borrower | Loan Amount |
|---|---|---|---|
| Previous Owner | Winnetucket Rt | $840,000 | |
| Previous Owner | Winnetucket Rt | $55,000 |
Source: Public Records
Tax History Compared to Growth
Tax History
| Year | Tax Paid | Tax Assessment Tax Assessment Total Assessment is a certain percentage of the fair market value that is determined by local assessors to be the total taxable value of land and additions on the property. | Land | Improvement |
|---|---|---|---|---|
| 2025 | $28,936 | $2,366,000 | $722,000 | $1,644,000 |
| 2024 | $27,869 | $2,275,000 | $688,000 | $1,587,000 |
| 2023 | $25,870 | $1,990,000 | $625,000 | $1,365,000 |
| 2022 | $25,006 | $1,812,000 | $569,000 | $1,243,000 |
| 2021 | $25,370 | $1,763,000 | $542,000 | $1,221,000 |
| 2020 | $23,646 | $1,683,000 | $542,000 | $1,141,000 |
| 2019 | $22,987 | $1,628,000 | $516,000 | $1,112,000 |
| 2018 | $22,751 | $1,591,000 | $615,000 | $976,000 |
| 2017 | $22,199 | $1,532,000 | $586,000 | $946,000 |
| 2016 | $20,323 | $1,392,000 | $558,000 | $834,000 |
| 2015 | $19,452 | $1,309,000 | $507,000 | $802,000 |
| 2014 | $18,798 | $1,212,000 | $461,000 | $751,000 |
Source: Public Records
Map
Nearby Homes
- 3 Brown Rd
- 36 Adams St
- 23 Burroughs Rd
- 12 Coolidge Ave
- 23 Thoreau Rd
- 1 Maureen Rd
- 125 Burlington St
- 25 Flintlock Rd
- 162 North St
- 6 Maureen Rd
- 3a Nowers Rd
- 101 Burlington St
- 103 N Hancock St
- 45 Hancock St
- 17 Hamilton Rd
- 92 Muller Rd
- 32 Edgewood Rd Unit 1
- 30 Meriam St Unit 30
- 93 Bedford St Unit 201
- 93 Bedford St Unit 308