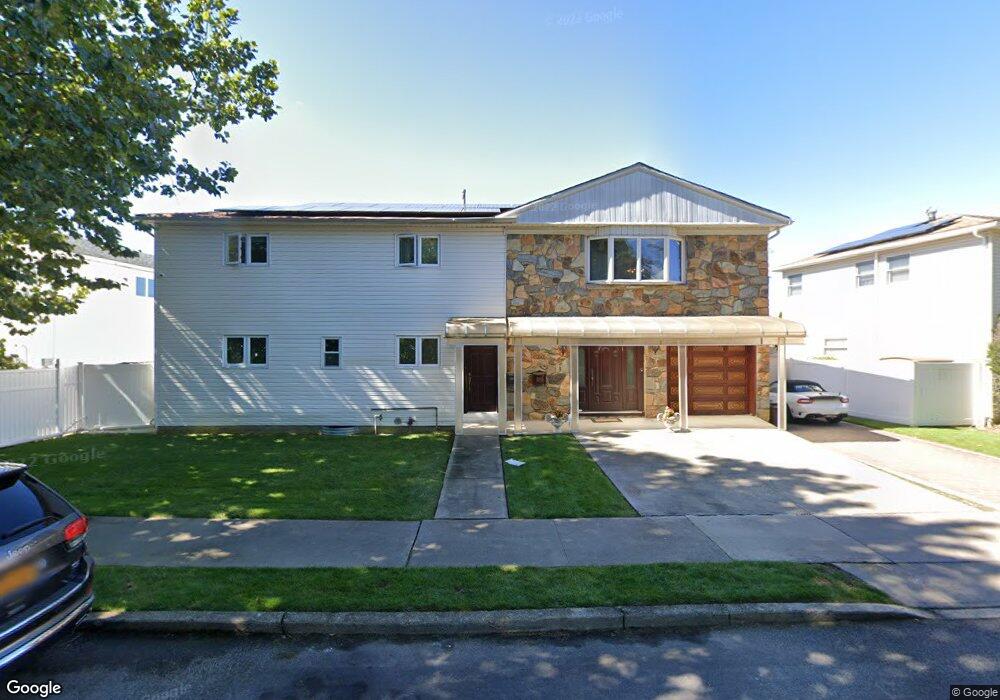
94 Brook Ave Staten Island, NY 10306
Oakwood NeighborhoodEstimated Value: $959,286 - $1,196,000
5
Beds
3
Baths
2,488
Sq Ft
$448/Sq Ft
Est. Value
About This Home
This home is located at 94 Brook Ave, Staten Island, NY 10306 and is currently estimated at $1,115,822, approximately $448 per square foot. 94 Brook Ave is a home located in Richmond County with nearby schools including P.S. 53 The Barbara Esselborn School, Myra S. Barnes Intermediate School 24, and New Dorp High School.
Ownership History
Date
Name
Owned For
Owner Type
Purchase Details
Closed on
Jan 14, 2000
Sold by
Okhtenberg Mikhail and Glaz Riveka
Bought by
Glaz Riveka
Current Estimated Value
Purchase Details
Closed on
Sep 3, 1997
Sold by
Stuart Rosalie
Bought by
Okhtenberg Mikhail and Glaz Riveka
Home Financials for this Owner
Home Financials are based on the most recent Mortgage that was taken out on this home.
Original Mortgage
$195,750
Outstanding Balance
$30,096
Interest Rate
7.38%
Estimated Equity
$1,085,726
Create a Home Valuation Report for This Property
The Home Valuation Report is an in-depth analysis detailing your home's value as well as a comparison with similar homes in the area
Home Values in the Area
Average Home Value in this Area
Purchase History
| Date | Buyer | Sale Price | Title Company |
|---|---|---|---|
| Glaz Riveka | $35,000 | First American Title Ins Co | |
| Okhtenberg Mikhail | $261,000 | -- |
Source: Public Records
Mortgage History
| Date | Status | Borrower | Loan Amount |
|---|---|---|---|
| Open | Okhtenberg Mikhail | $195,750 |
Source: Public Records
Tax History Compared to Growth
Tax History
| Year | Tax Paid | Tax Assessment Tax Assessment Total Assessment is a certain percentage of the fair market value that is determined by local assessors to be the total taxable value of land and additions on the property. | Land | Improvement |
|---|---|---|---|---|
| 2025 | $9,076 | $56,220 | $11,622 | $44,598 |
| 2024 | $9,076 | $56,700 | $11,524 | $45,176 |
| 2023 | $9,108 | $44,846 | $10,701 | $34,145 |
| 2022 | $5,469 | $49,560 | $14,460 | $35,100 |
| 2021 | $8,400 | $41,040 | $14,460 | $26,580 |
| 2020 | $5,423 | $45,360 | $14,460 | $30,900 |
| 2019 | $5,330 | $46,260 | $14,460 | $31,800 |
| 2018 | $7,618 | $37,372 | $10,984 | $26,388 |
| 2017 | $7,187 | $35,257 | $14,185 | $21,072 |
| 2016 | $6,649 | $33,262 | $13,250 | $20,012 |
| 2015 | $6,022 | $31,380 | $12,060 | $19,320 |
| 2014 | $6,022 | $31,380 | $12,060 | $19,320 |
Source: Public Records
Map
Nearby Homes