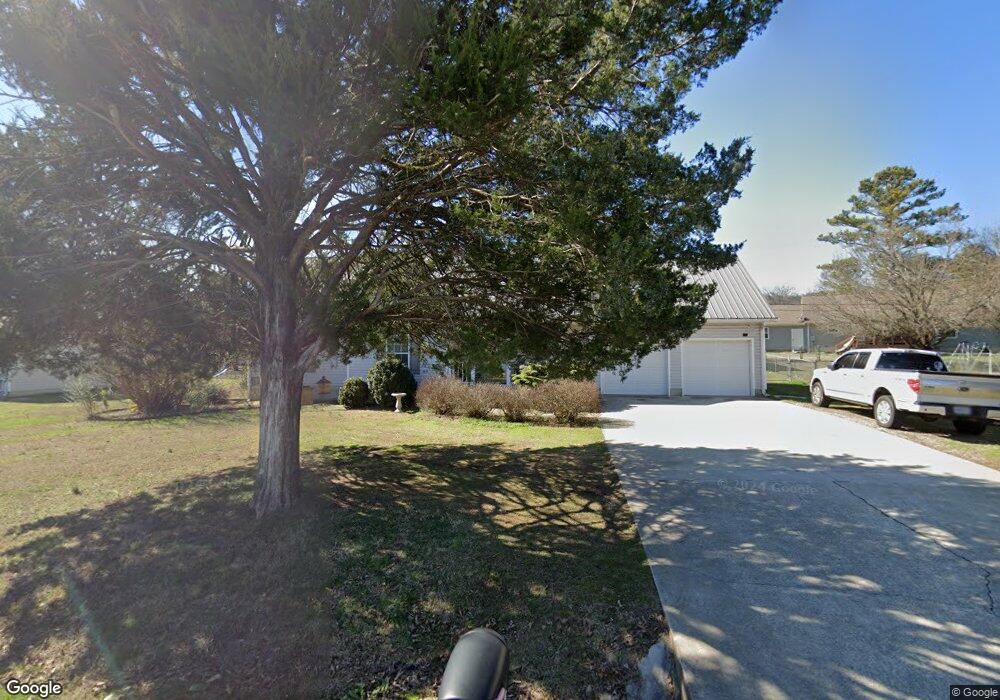
94 Cedar Ln Trenton, GA 30752
Estimated Value: $255,000 - $260,004
3
Beds
2
Baths
1,430
Sq Ft
$180/Sq Ft
Est. Value
About This Home
This home is located at 94 Cedar Ln, Trenton, GA 30752 and is currently estimated at $256,751, approximately $179 per square foot. 94 Cedar Ln is a home located in Dade County with nearby schools including Dade Middle School and Dade County High School.
Ownership History
Date
Name
Owned For
Owner Type
Purchase Details
Closed on
Jan 23, 2009
Sold by
Reeves Colby
Bought by
Gilbreath Justin
Current Estimated Value
Home Financials for this Owner
Home Financials are based on the most recent Mortgage that was taken out on this home.
Original Mortgage
$120,972
Outstanding Balance
$76,668
Interest Rate
5.23%
Mortgage Type
New Conventional
Estimated Equity
$180,083
Purchase Details
Closed on
Jun 12, 2006
Sold by
Gravitt Dennis L
Bought by
Reeves Colby
Home Financials for this Owner
Home Financials are based on the most recent Mortgage that was taken out on this home.
Original Mortgage
$96,000
Interest Rate
6.49%
Mortgage Type
New Conventional
Purchase Details
Closed on
May 18, 2001
Sold by
Hammond Donald and Hammond A
Bought by
Gravitt Dennis L
Purchase Details
Closed on
Apr 24, 1997
Sold by
Goolesby Johnathan
Bought by
Hammond Donald and Hammond A
Create a Home Valuation Report for This Property
The Home Valuation Report is an in-depth analysis detailing your home's value as well as a comparison with similar homes in the area
Home Values in the Area
Average Home Value in this Area
Purchase History
| Date | Buyer | Sale Price | Title Company |
|---|---|---|---|
| Gilbreath Justin | $118,600 | -- | |
| Gilbreath Justin | $118,600 | -- | |
| Gilbreath Justin | $118,600 | -- | |
| Reeves Colby | $120,000 | -- | |
| Gravitt Dennis L | $88,000 | -- | |
| Hammond Donald | $79,000 | -- |
Source: Public Records
Mortgage History
| Date | Status | Borrower | Loan Amount |
|---|---|---|---|
| Open | Gilbreath Justin | $120,972 | |
| Closed | Gilbreath Justin | $120,972 | |
| Previous Owner | Reeves Colby | $96,000 |
Source: Public Records
Tax History Compared to Growth
Tax History
| Year | Tax Paid | Tax Assessment Tax Assessment Total Assessment is a certain percentage of the fair market value that is determined by local assessors to be the total taxable value of land and additions on the property. | Land | Improvement |
|---|---|---|---|---|
| 2024 | $891 | $80,640 | $4,960 | $75,680 |
| 2023 | $899 | $74,600 | $4,960 | $69,640 |
| 2022 | $899 | $67,880 | $4,320 | $63,560 |
| 2021 | $904 | $54,640 | $4,320 | $50,320 |
| 2020 | $933 | $51,920 | $4,320 | $47,600 |
| 2019 | $942 | $50,440 | $4,320 | $46,120 |
| 2018 | $1,210 | $50,440 | $4,320 | $46,120 |
| 2017 | $959 | $43,560 | $4,320 | $39,240 |
| 2016 | $955 | $43,560 | $4,320 | $39,240 |
| 2015 | $933 | $43,560 | $4,320 | $39,240 |
| 2014 | -- | $41,720 | $2,640 | $39,080 |
| 2013 | -- | $41,960 | $2,640 | $39,320 |
Source: Public Records
Map
Nearby Homes
- 11080 U S 11
- 134 Melissa Dr
- 204 Melissa Dr
- 493 Bernice Dr
- 738 Sells Ln
- 165 N Woods Ln
- 0 Northwoods Ln Unit 1521613
- 54 Whispering Pines Dr
- 553 Back Valley Rd
- 0 Georgia 136
- 102 Sunset Dr
- 000 W Ga 136 Hwy
- 329 Glenview Dr
- 331 Glenview Dr
- 1150 Back Valley Rd
- 394 Glenview Dr
- 396 Glenview Dr
- 40 Case Cir
- 272 Cloud Rd
- 51 N Case Ave